Fig. 10
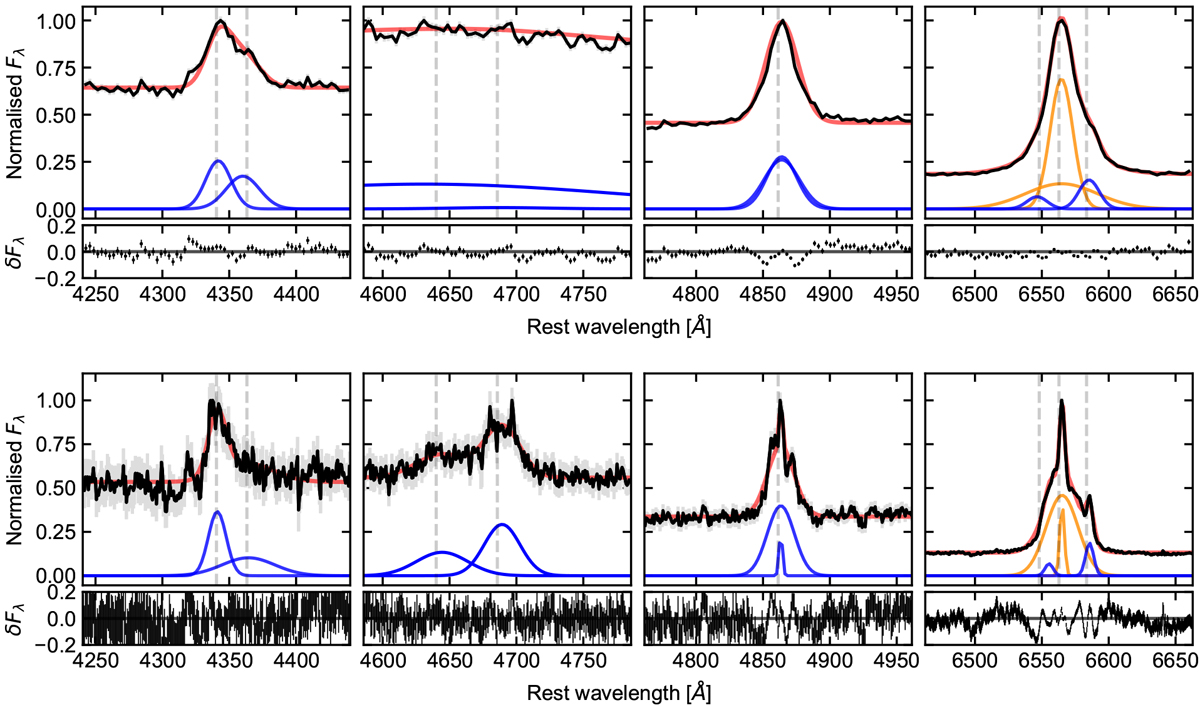
Zoomed-in plots of the main emission lines observed in both the NOT and WiFeS spectra (top and bottom panels respectively). The black line is the observed flux density, and the grey error bars are the associated uncertainties. We plot our fitted spectral model to the data for each region in red (including background component), whilst the blue and orange lines along the bottom represent the contribution of each source component to the fit (further described inTable A.2). The lower plots in each panel show the residuals in the spectral fitting, where δFλ is the difference between the observed Fλ and the model Fλ, normalised by the model Fλ. We note that the double peaked appearance of the He II emission line in the WiFeS spectrum is most likely non-physical and due to the noisy optical spectrum, as no other broad lines show such similar line profiles.
Current usage metrics show cumulative count of Article Views (full-text article views including HTML views, PDF and ePub downloads, according to the available data) and Abstracts Views on Vision4Press platform.
Data correspond to usage on the plateform after 2015. The current usage metrics is available 48-96 hours after online publication and is updated daily on week days.
Initial download of the metrics may take a while.