Fig. 9.
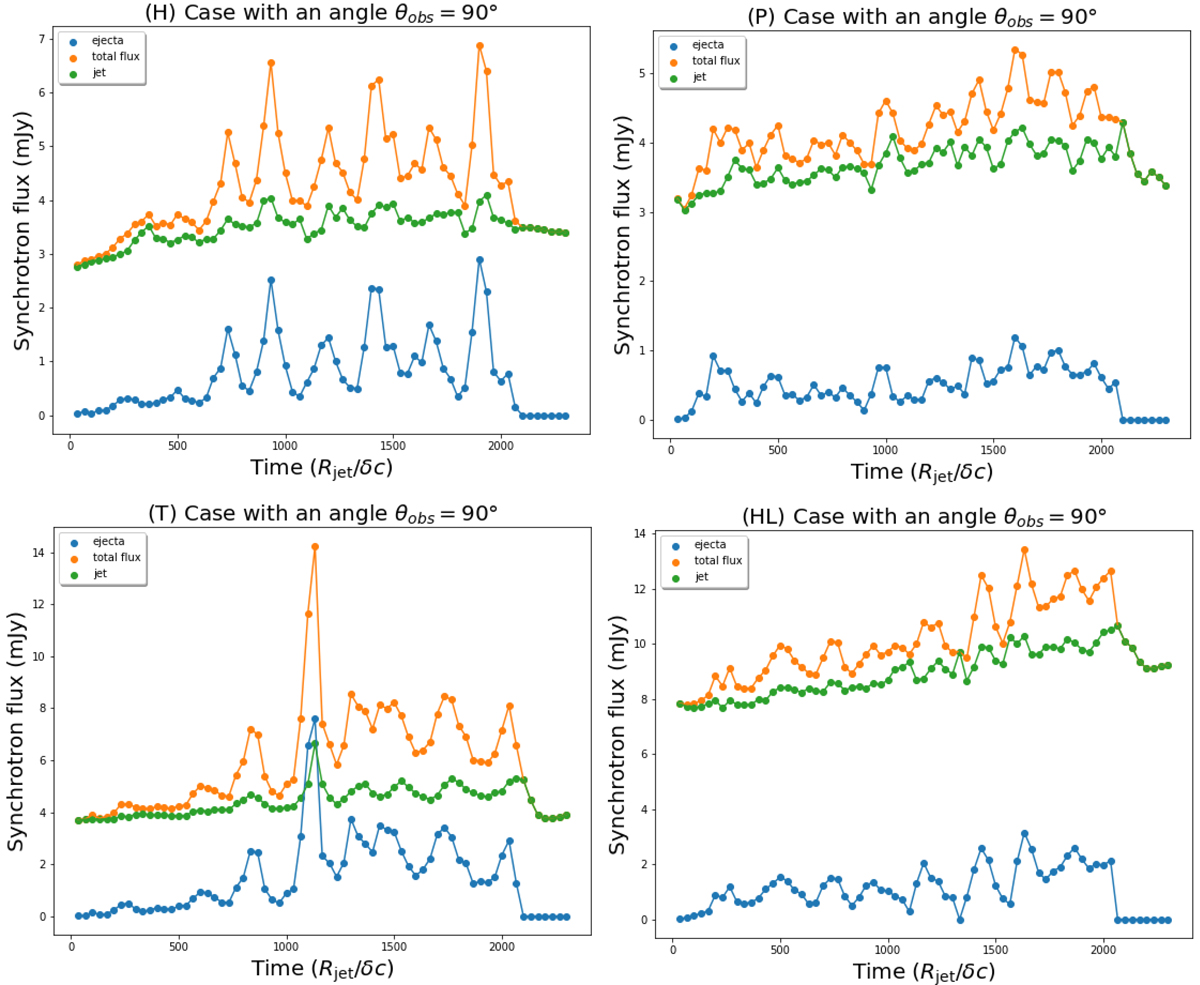
Light curve obtained by integrating the total synchrotron flux emitted from a simulation box with a size of [R = 8, Z = 200] Rjet. The computation of the light curve is realized from the four different cases of jets (H, T, P and HL). The flux is integrated from t = 0 the time of the injection of the ejecta, until t ∼ 2300 Rjet/δ with δ(θobs = 90° ) = 0.1 in the absolute mobile frame and with ν = 1 GHz. We separate the total flux (orange) in two component: the jet (green) and the moving shock wave (blue). Movies showing the temporal evolution of the synchrotron flux map and associated light curves are available online.
Current usage metrics show cumulative count of Article Views (full-text article views including HTML views, PDF and ePub downloads, according to the available data) and Abstracts Views on Vision4Press platform.
Data correspond to usage on the plateform after 2015. The current usage metrics is available 48-96 hours after online publication and is updated daily on week days.
Initial download of the metrics may take a while.