Fig. 8.
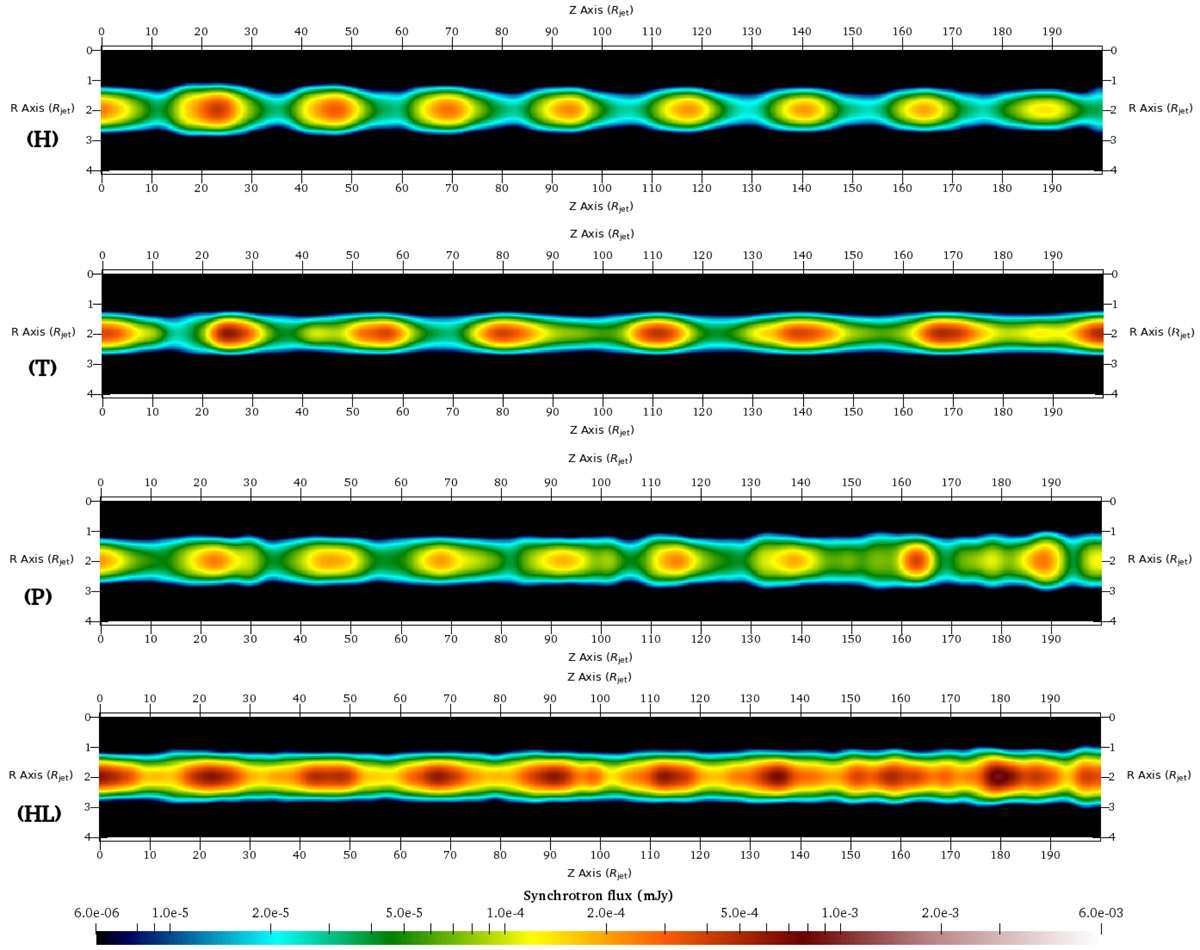
Snapshot: synchrotron emission map of the different types of jets (H, T, P, and HL) without ejecta and stationnary. Each map represent the flux intensity in mJy unit. The R and Z-axis are given in Rjet unit. These maps represent a resolution of the radiative transfer equation with an angle between the jet propagation axis and the line of sight equal to θobs = 90° and ν = 1 GHz.
Current usage metrics show cumulative count of Article Views (full-text article views including HTML views, PDF and ePub downloads, according to the available data) and Abstracts Views on Vision4Press platform.
Data correspond to usage on the plateform after 2015. The current usage metrics is available 48-96 hours after online publication and is updated daily on week days.
Initial download of the metrics may take a while.