Open Access
Fig. 4.
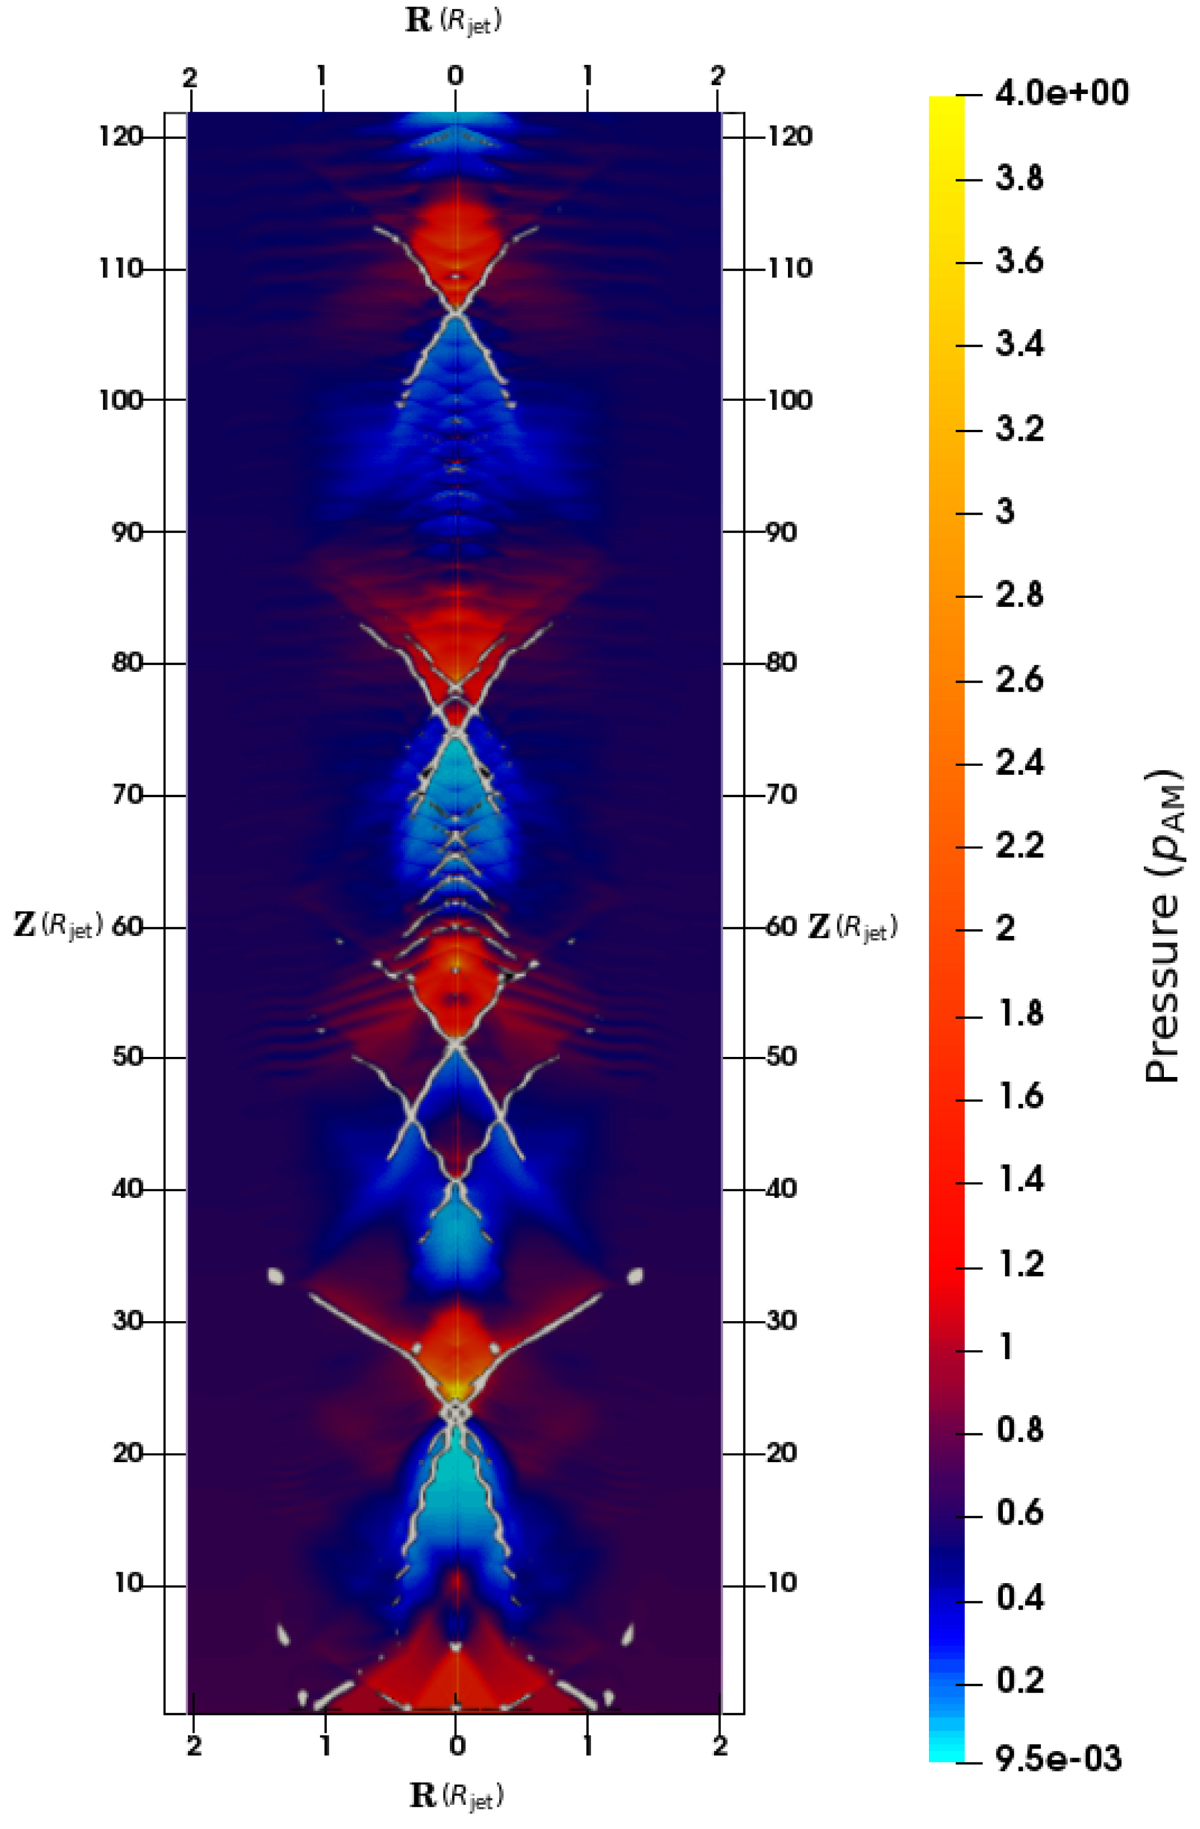
Zoom on the base of the toroidal jet (T). A standing shock structure appears on the pressure map. The R-axis and the Z-axis are given in Rjet unit. The white lines represent the rarefaction and compression wave shock fronts.
Current usage metrics show cumulative count of Article Views (full-text article views including HTML views, PDF and ePub downloads, according to the available data) and Abstracts Views on Vision4Press platform.
Data correspond to usage on the plateform after 2015. The current usage metrics is available 48-96 hours after online publication and is updated daily on week days.
Initial download of the metrics may take a while.