Fig. 11.
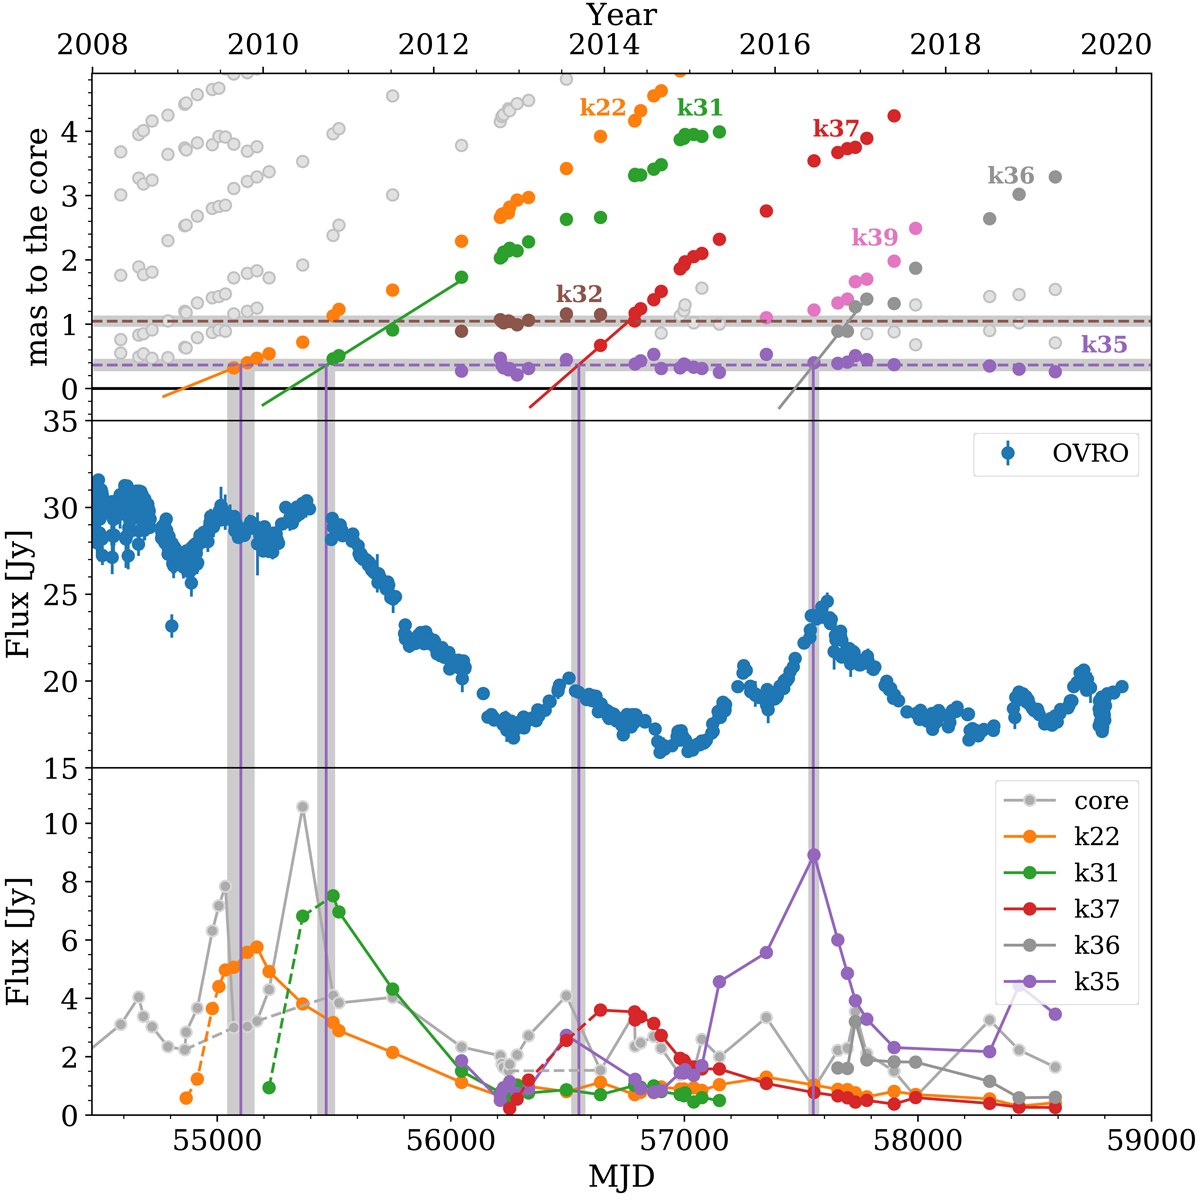
3C 273 observed at 15.3 GHz. Top panel: distance to the core of radio knots analyzed by MOJAVE. We focus on the firmly identified components (in color). Straight lines are linear extrapolations of the moving knots based on their first 4 observations. Horizontal dashed lines show the mean position in the jet of the two observed quasi-stationary knots k32 and k35, with the gray band displaying the 1 sigma dispersion around the mean. Middle panel: radio jet light curve observed by OVRO. Bottom panel: measured flux of the radio core and moving knots. Dashed lines (extrapolation assuming smooth core emission) indicate that the observed core variability is actually due to the flux increase of the emerging moving knots when they are indiscernible from the core due to the limits of the VLBA angular resolution. Vertical lines show the most likely time when the moving knots pass through the stationary zone defined by k35 and the purple dashed line, with its associated uncertainty in gray.
Current usage metrics show cumulative count of Article Views (full-text article views including HTML views, PDF and ePub downloads, according to the available data) and Abstracts Views on Vision4Press platform.
Data correspond to usage on the plateform after 2015. The current usage metrics is available 48-96 hours after online publication and is updated daily on week days.
Initial download of the metrics may take a while.