Fig. C.3.
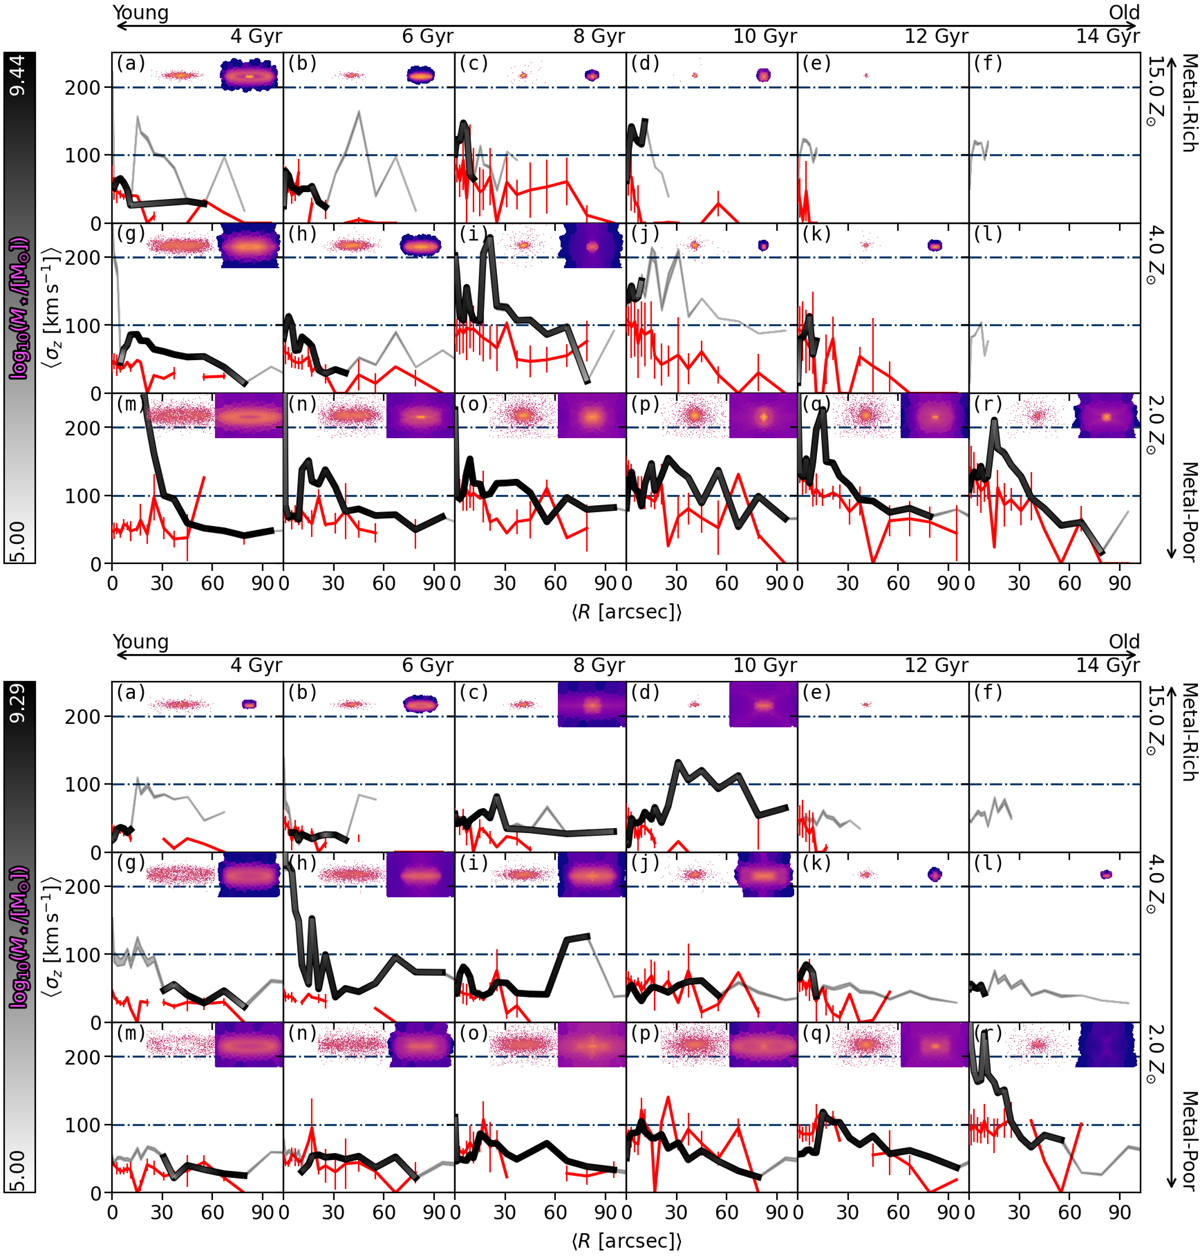
Similar to Fig. 10, showing the assembly history for halo 5 (top) and halo 6 (bottom). In addition to the σz radial profile (black/white line) and surface brightness distribution (upper right) from the Schwarzschild model, the shaded regions correspond to the variations derived from 100 Monte Carlo fits to the stellar population maps. Each panel also contains the intrinsic σz radial profile (red line) and surface brightness distribution (upper left) from the simulations.
Current usage metrics show cumulative count of Article Views (full-text article views including HTML views, PDF and ePub downloads, according to the available data) and Abstracts Views on Vision4Press platform.
Data correspond to usage on the plateform after 2015. The current usage metrics is available 48-96 hours after online publication and is updated daily on week days.
Initial download of the metrics may take a while.