Fig. C.2.
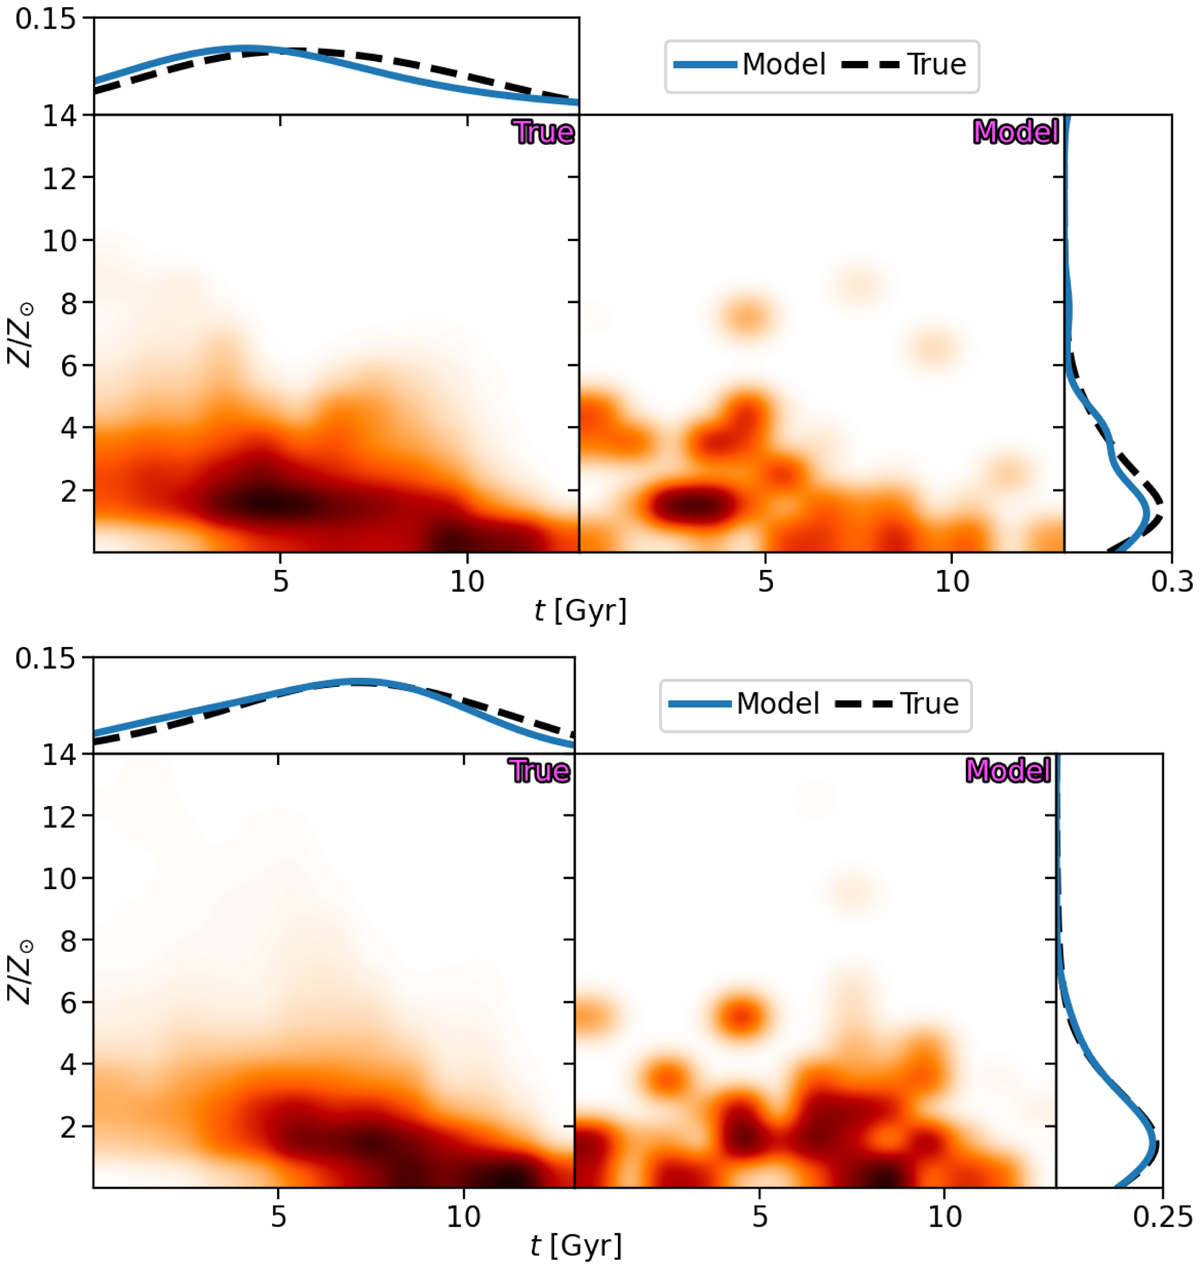
Intrinsic t−z distribution (left) and that retrieved from our model (right) for halos 5 (top) and 6 (bottom). The 1D distributions are also shown for each simulation, as kernel density estimates of the underlying data. The intrinsic distributions are black dashed curves, and the model distributions are the blue solid curves.
Current usage metrics show cumulative count of Article Views (full-text article views including HTML views, PDF and ePub downloads, according to the available data) and Abstracts Views on Vision4Press platform.
Data correspond to usage on the plateform after 2015. The current usage metrics is available 48-96 hours after online publication and is updated daily on week days.
Initial download of the metrics may take a while.