Fig. A.1.
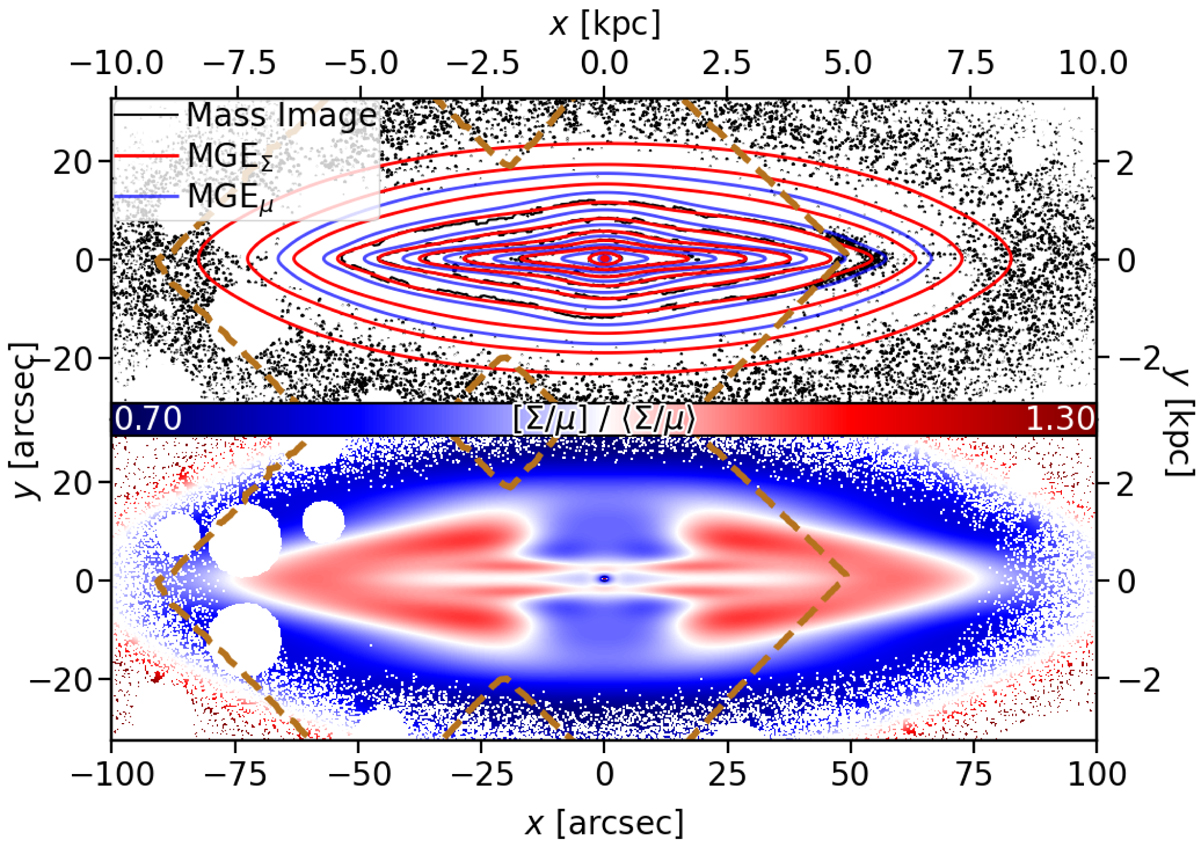
Mass-density MGE for FCC 153. Top: contours of the projected mass density (black), the mass density MGE∑ (red), and the surface brightness MGEμ (blue). Bottom: ratio between the mass and surface-brightness models, showing the structural differences. This panel is normalised by the average M⋆/L such that values of 1.0 (white) are consistent with the assumption of a spatially-constant M⋆/L, and any deviations are percentages in stellar mass. The outline of the MUSE mosaic is shown in dashed brown.
Current usage metrics show cumulative count of Article Views (full-text article views including HTML views, PDF and ePub downloads, according to the available data) and Abstracts Views on Vision4Press platform.
Data correspond to usage on the plateform after 2015. The current usage metrics is available 48-96 hours after online publication and is updated daily on week days.
Initial download of the metrics may take a while.