Free Access
Fig. 9.
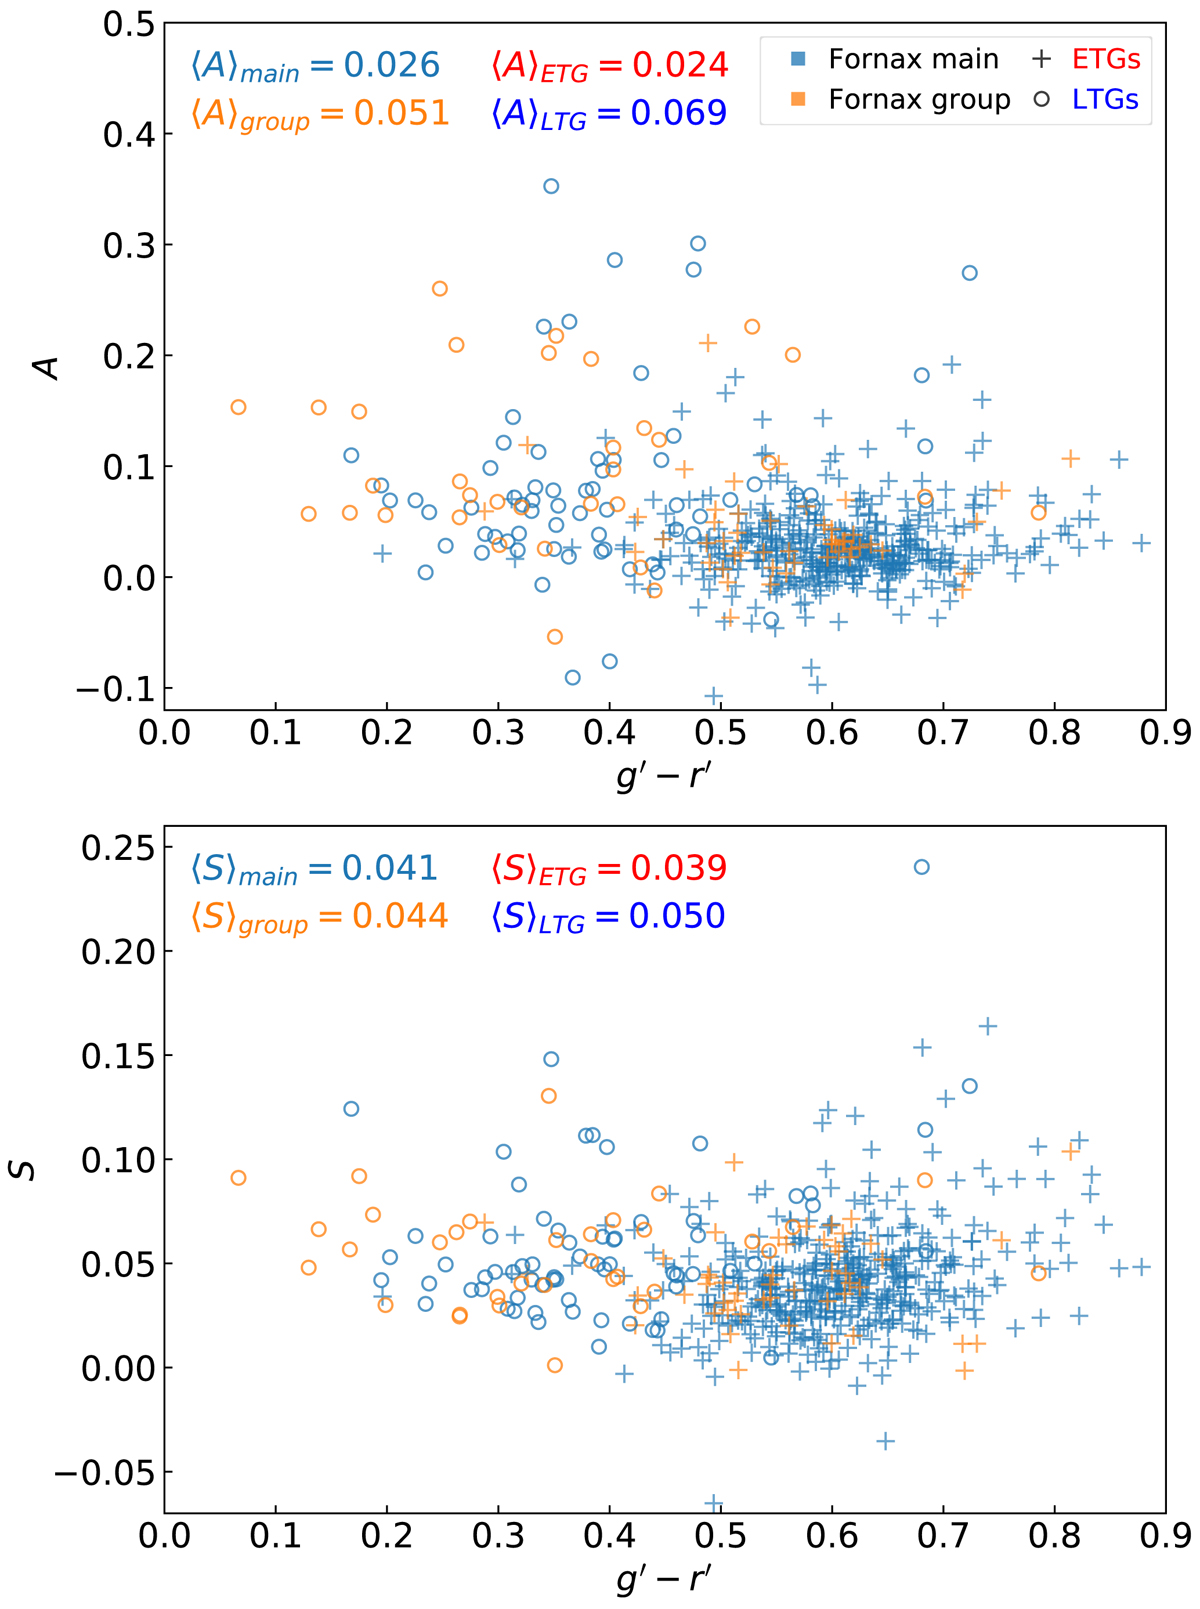
Asymmetry (upper panel) and clumpiness (lower panel) index as a function of g′−r′ colour, split between Fornax main (blue) and Fornax group (orange), as well as ETGs (plus) and LTGs (circle). Here ⟨A⟩ and ⟨S⟩ denote the median values of asymmetry and clumpiness, respectively, for each sub-sample.
Current usage metrics show cumulative count of Article Views (full-text article views including HTML views, PDF and ePub downloads, according to the available data) and Abstracts Views on Vision4Press platform.
Data correspond to usage on the plateform after 2015. The current usage metrics is available 48-96 hours after online publication and is updated daily on week days.
Initial download of the metrics may take a while.