Fig. 6.
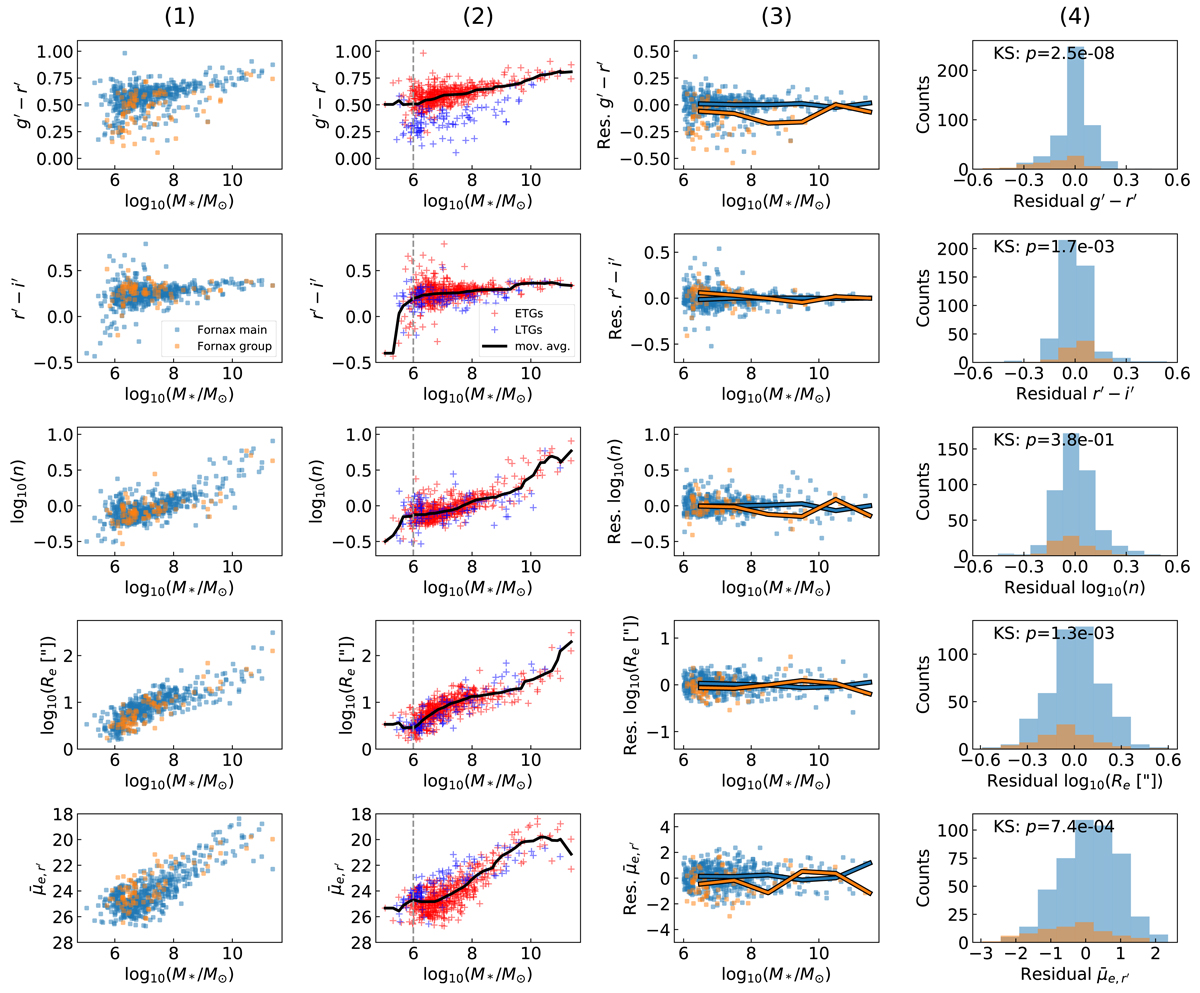
Scaling relations for r′-band Sérsic-derived quantities from Sérsic+PSF decompositions. Column 1: g′−r′ colour, r′−i′ colour, Sérsic index, effective radius (in arcsec), and mean effective surface brightness (in mag arcsec−2) as a function of stellar mass, between Fornax main (blue) and Fornax group (orange) galaxies. Column 2: similar to Col. 1, but split between ETGs (red crosses) and LTGs (dark blue crosses). The solid black lines denote the moving averages (median) based on moving a fixed-size bin through increasing stellar mass to find the mass dependence in each parameter. The vertical grey dashed line denotes log10(M*/M⊙) = 6. Column 3: residual parameters (i.e. parameters minus derived mass-trend from moving averages) as a function of mass. The solid lines denote the median residual value within stellar mass bins of width 1 dex for the Fornax main (blue) and Fornax group (orange) sub-samples, respectively. Galaxies with log10(M*/M⊙) < 6 were excluded due to incompleteness in the sample. Column 4: distribution of the residual parameters for the Fornax main (blue) and Fornax group (orange) sub-samples. The p-value from null hypothesis tests (i.e. both sub-samples are drawn from the same distribution) are annotated in the plot, indicating the probability that both distributions are drawn from the same sample.
Current usage metrics show cumulative count of Article Views (full-text article views including HTML views, PDF and ePub downloads, according to the available data) and Abstracts Views on Vision4Press platform.
Data correspond to usage on the plateform after 2015. The current usage metrics is available 48-96 hours after online publication and is updated daily on week days.
Initial download of the metrics may take a while.