Fig. 5.
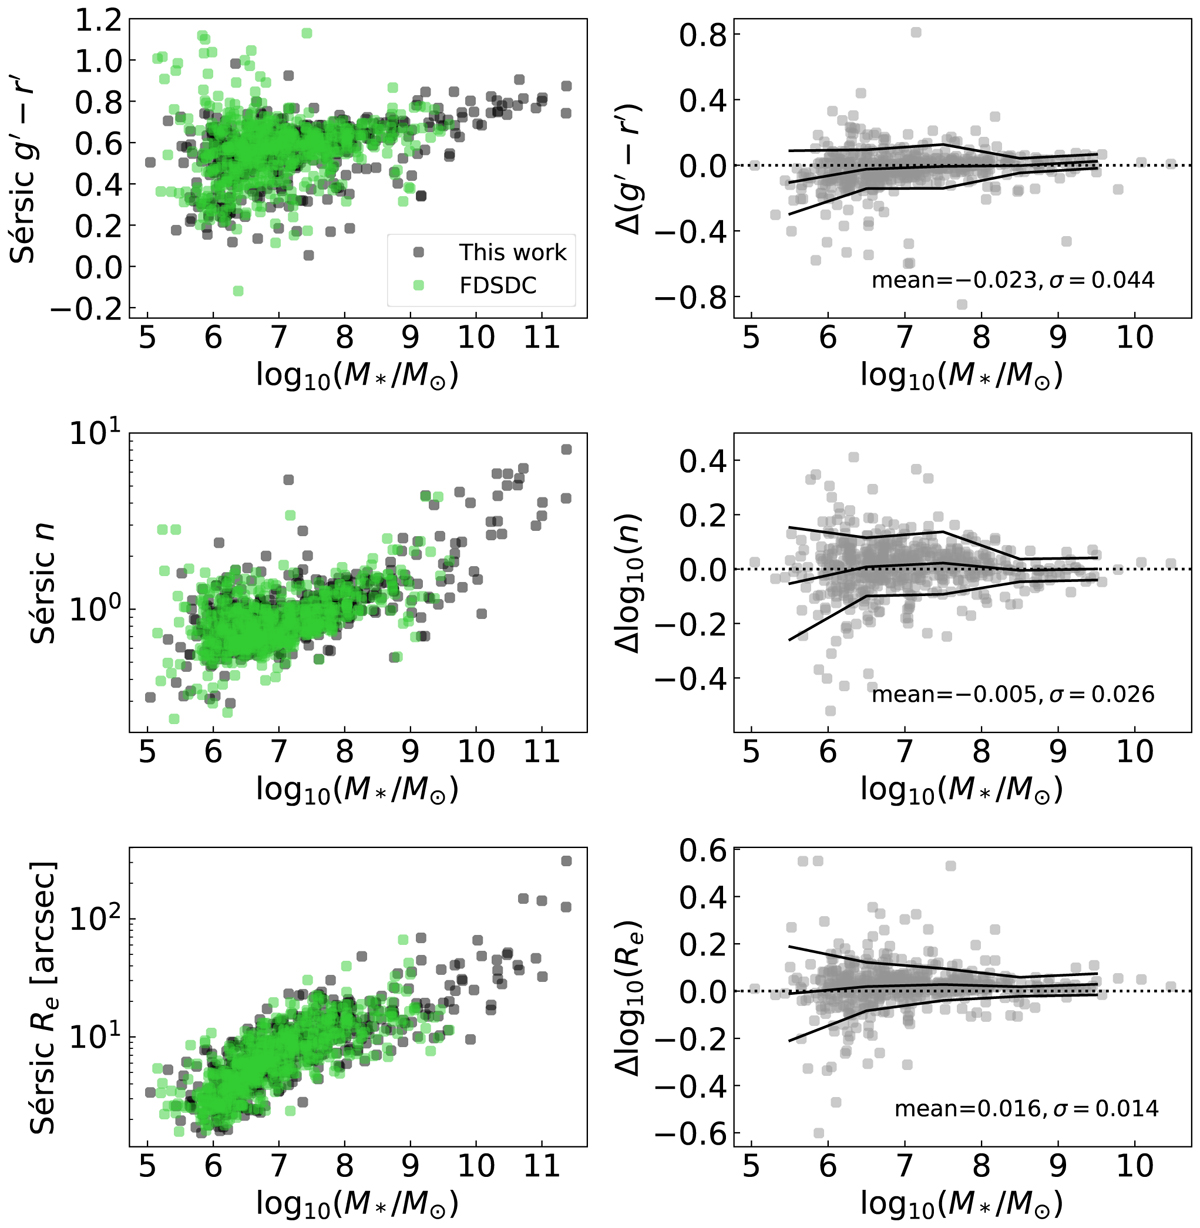
Comparison of the r′-band Sérsic-derived quantities from Sérsic+PSF decompositions between those made in this work and in FDSDC10. FDSDC sample ranges from −9 > Mr′ > −18.5, corresponding to 105 M⊙ ≲ M* ≲ 109 M⊙. Left panels: relations of Sérsic-derived quantities as a function of stellar mass. Right panels: difference in Sérsic-derived quantities for each galaxy (where the samples overlap) as a function of the parameters determined in this work. Here Δ is defined as the values from this work minus the values from FDSDC. The black lines denote the mean and ±rms in bins of 1 dex. The annotations show the mean and standard deviation of the means of Δ.
Current usage metrics show cumulative count of Article Views (full-text article views including HTML views, PDF and ePub downloads, according to the available data) and Abstracts Views on Vision4Press platform.
Data correspond to usage on the plateform after 2015. The current usage metrics is available 48-96 hours after online publication and is updated daily on week days.
Initial download of the metrics may take a while.