Fig. 4.
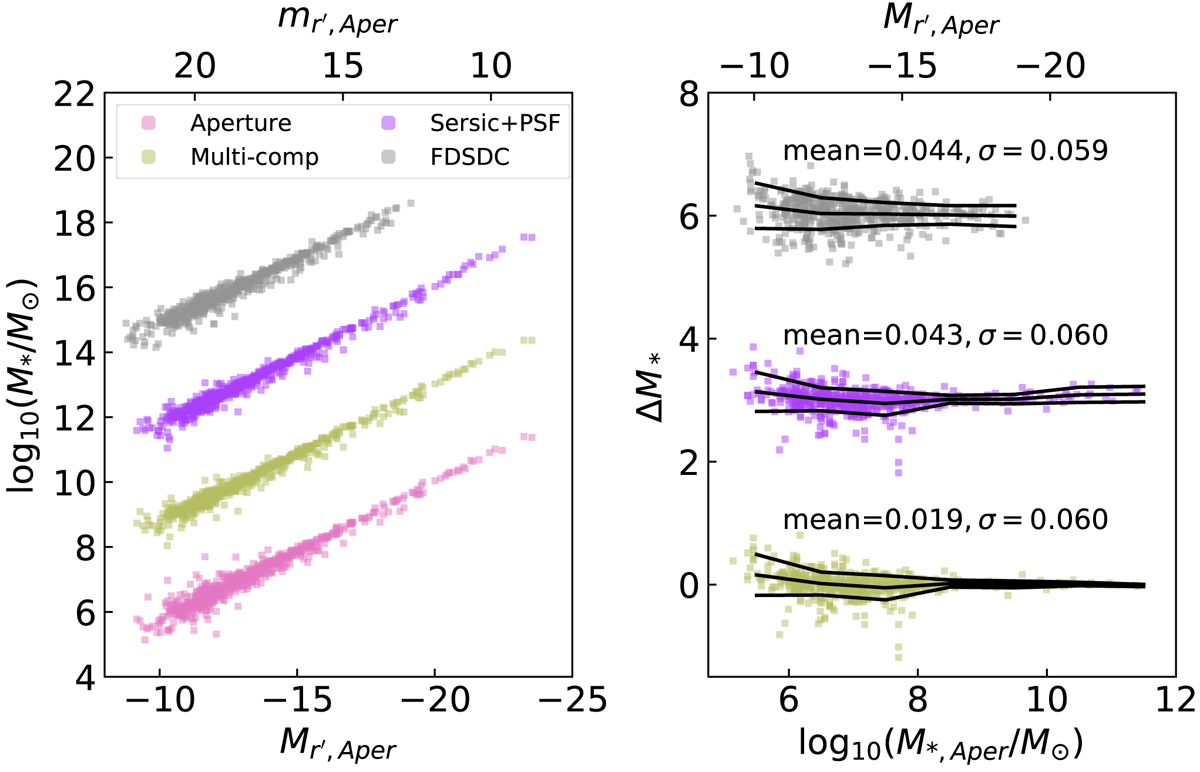
Comparison of stellar mass calculated via different methods of determining total magnitudes, as a function of r′-band total magnitudes (left) and stellar mass from aperture photometry (right). Stellar masses for FDSDC were estimated by multiplying the fluxes in each band by a factor of two, as the aperture used in Venhola et al. (2018) only extended to one effective radius. The black lines denote the mean and ±rms in bins of 1 dex. The annotations show the mean and standard deviation of the means of ΔM*, where ΔM* is defined as the difference in exponents (i.e. log10(M*, Aper)−log10(M*, other)). For better visibility, each relation is offset by 3 dex relative to each other, with “Aperture” (pink) as the reference relation on the left plot whilst “Multi-comp” (green) as the reference relation on the right plot.
Current usage metrics show cumulative count of Article Views (full-text article views including HTML views, PDF and ePub downloads, according to the available data) and Abstracts Views on Vision4Press platform.
Data correspond to usage on the plateform after 2015. The current usage metrics is available 48-96 hours after online publication and is updated daily on week days.
Initial download of the metrics may take a while.