Fig. G.1.
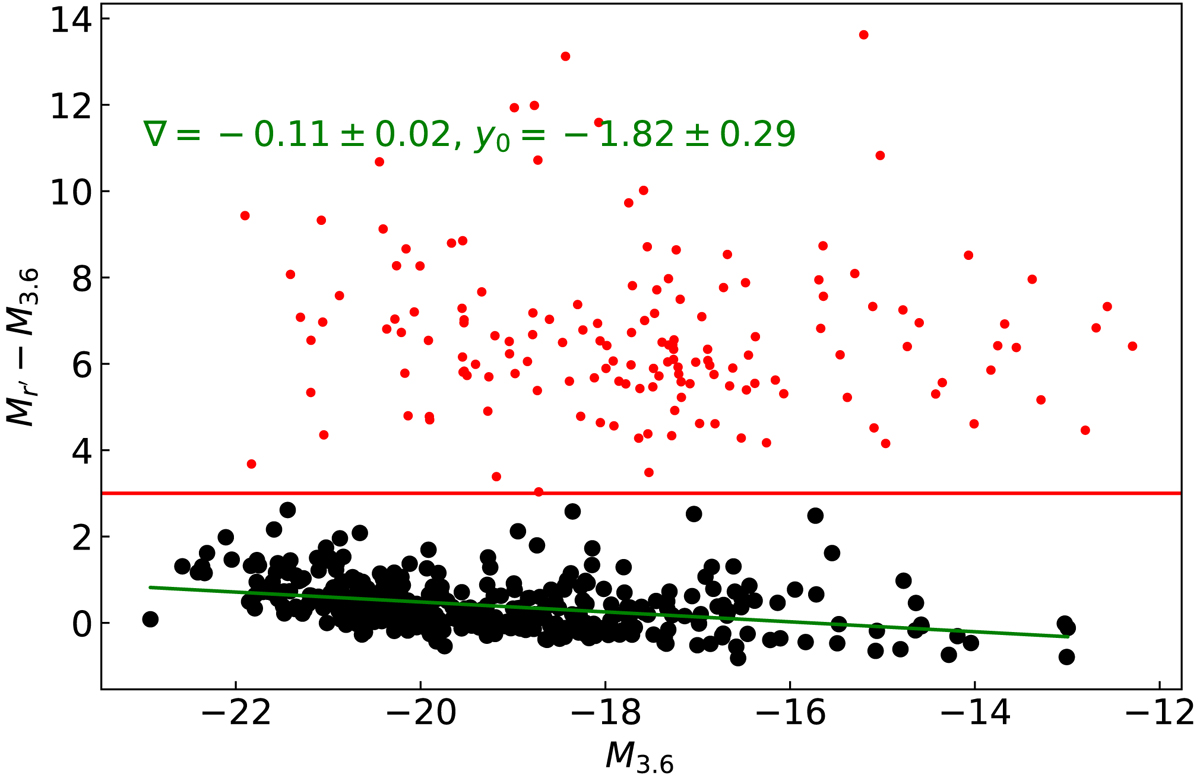
r′−3.6 colour as a function of M3.6 for the S4G sample. The black points show the galaxies used to derive a transformation between r′-band and 3.6 μm magnitudes. The solid red line (Mr′ − M3.6 = 3) denotes the limit where the SDSS r′-band magnitudes were untrustworthy (i.e. Mr′ − M3.6 colour too red to be physical). The green line denotes the linear fit, with the gradient and intercept annotated in the plot.
Current usage metrics show cumulative count of Article Views (full-text article views including HTML views, PDF and ePub downloads, according to the available data) and Abstracts Views on Vision4Press platform.
Data correspond to usage on the plateform after 2015. The current usage metrics is available 48-96 hours after online publication and is updated daily on week days.
Initial download of the metrics may take a while.