Fig. D.3.
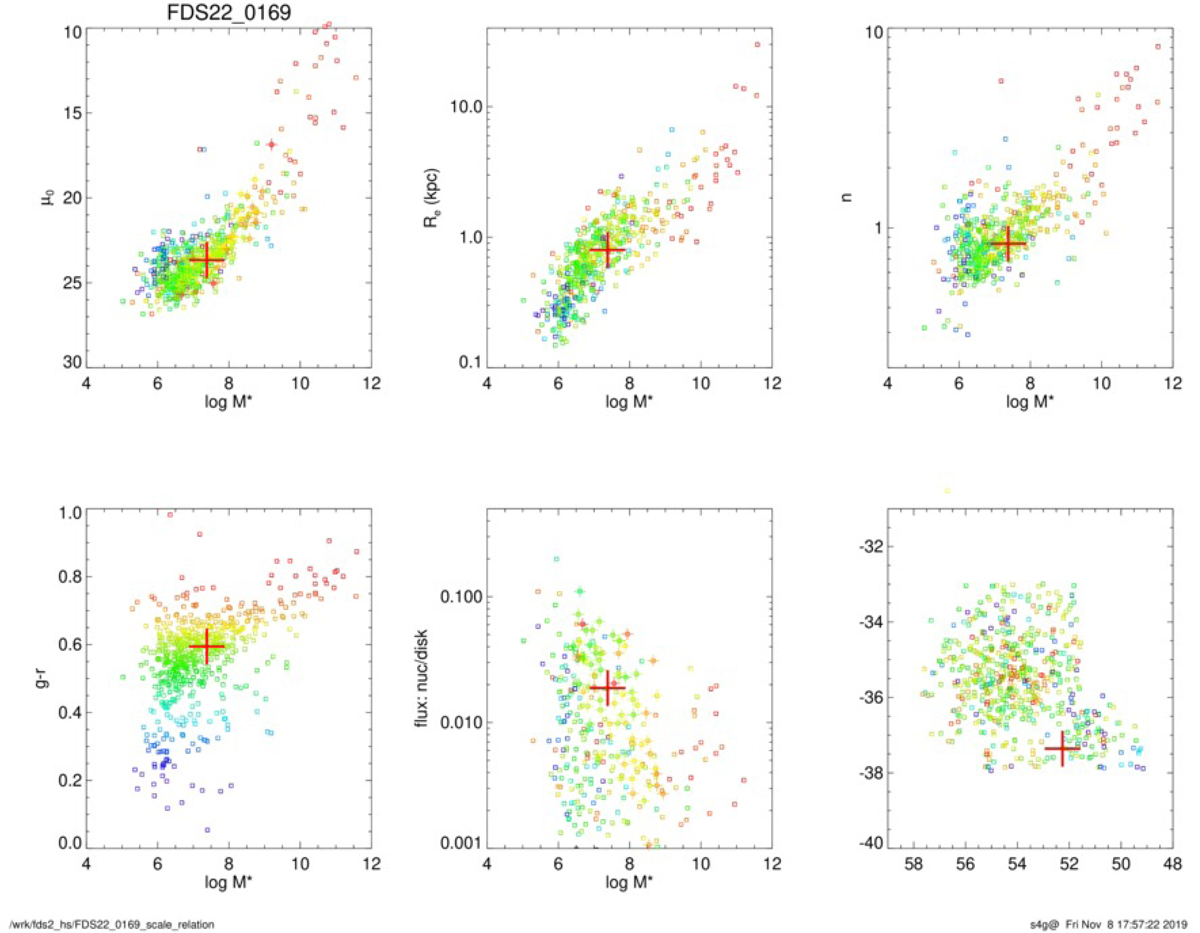
Various scaling relations (based on quantities derived from Sérsic+PSF decompositions) as a function of stellar mass. The red cross indicates the location of the galaxy (in this case FDS22_0169). The colours of data points denote the g′−r′ colours of the galaxies. Upper left: central surface brightness. Upper centre: effective radius. Upper right: Sérsic index. Lower left: g′−r′ colour. Lower centre: flux ratio between the PSF and Sérsic components (denoted as nucleus and disk). Lower right: location of the galaxy in Fornax (x-axis: right ascension, y-axis: declination).
Current usage metrics show cumulative count of Article Views (full-text article views including HTML views, PDF and ePub downloads, according to the available data) and Abstracts Views on Vision4Press platform.
Data correspond to usage on the plateform after 2015. The current usage metrics is available 48-96 hours after online publication and is updated daily on week days.
Initial download of the metrics may take a while.