Fig. C.3.
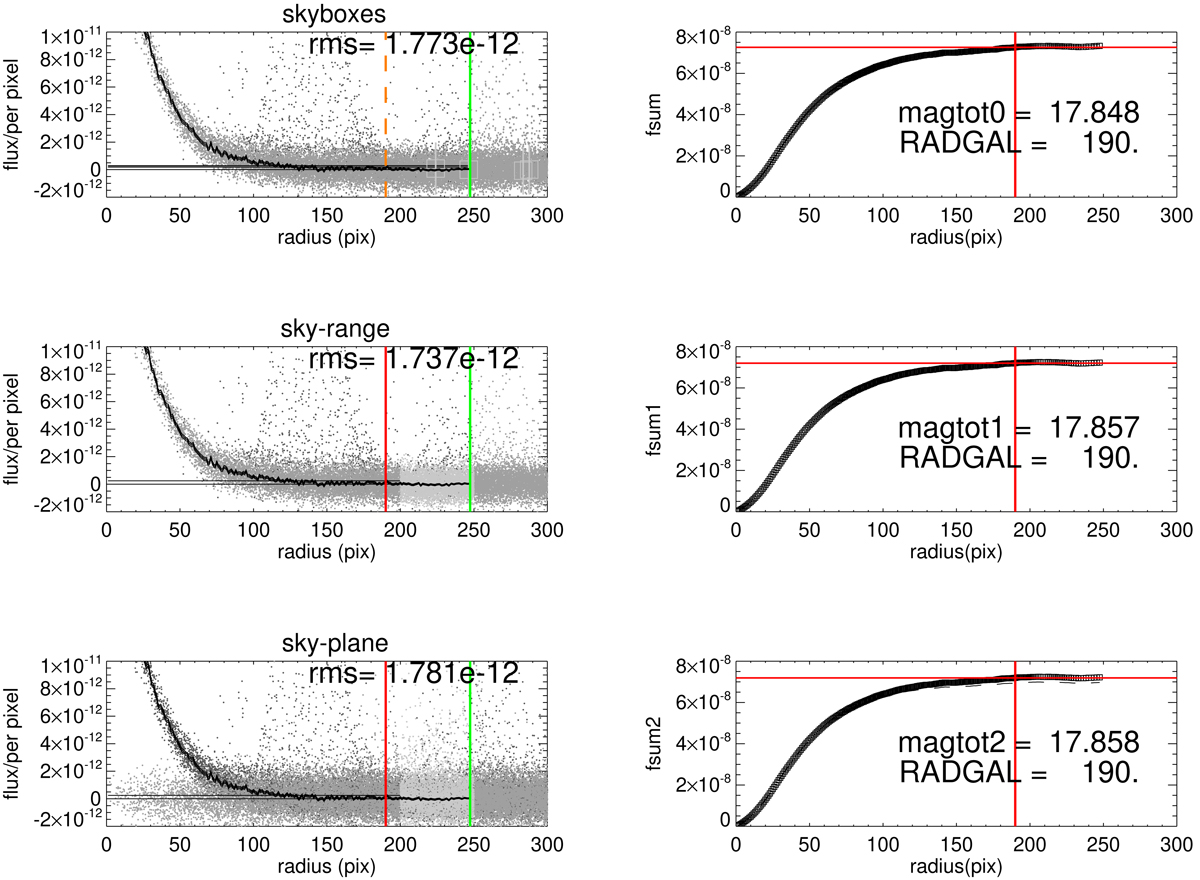
Left panels: azimuthally averaged flux profiles (solid black lines) of FDS22_0169 with different sky subtraction based on the (r′-band) cleanimages: skyboxes (upper), sky annulus (centre), and skyplane (lower). The dark grey points show the flux of individual pixels (in the AB system (Oke & Gunn 1983); in units of 3631 Jy = 3631 × 10−26 W m−2 Hz−1) in the postage stamp image, while the light grey denotes the sky annulus region. The red (and orange) vertical lines denote the visually estimated maximum extent of the galaxy (i.e. radgal). The green vertical line marks the outermost elliptical annulus within the dimensions of the postage stamp image. Right panels: corresponding cumulative flux profiles of FDS22_0169 with different sky subtraction. The solid red lines denotes the same extent of the galaxy, from which the total aperture magnitude is calculated.
Current usage metrics show cumulative count of Article Views (full-text article views including HTML views, PDF and ePub downloads, according to the available data) and Abstracts Views on Vision4Press platform.
Data correspond to usage on the plateform after 2015. The current usage metrics is available 48-96 hours after online publication and is updated daily on week days.
Initial download of the metrics may take a while.