Fig. 2.
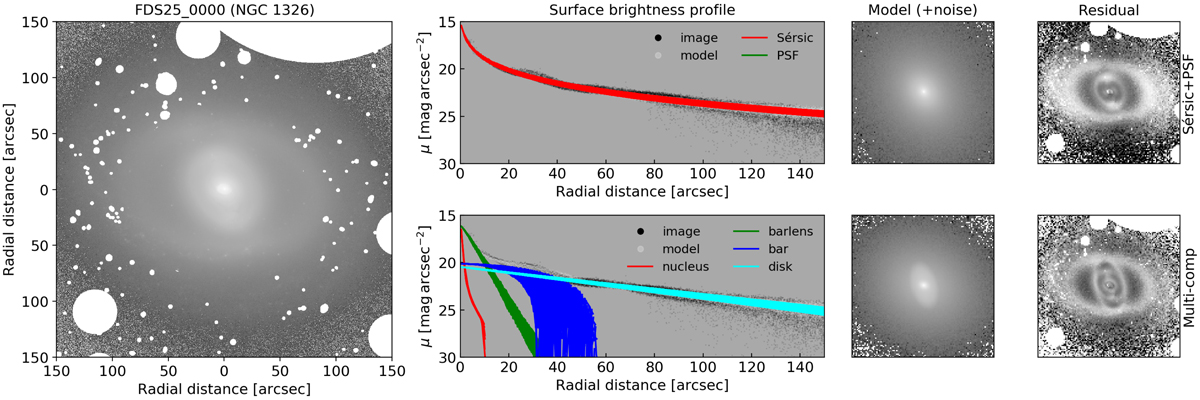
Overview of the Sérsic+PSF (upper row) and multi-component (lower row) decompositions for FDS25_0000 (NGC 1326). In the first column from the left, we show the masked galaxy image (within the inner 150 arcsec region). The second column shows the surface brightness profiles of the corresponding masked galaxy image as well as the decomposition models. The individual functions/components of the models are also shown, which highlight their contributions to the overall model. The third and fourth columns show the model and residual images, respectively, within the same region as the masked galaxy image. A range of 30–15 mag arcsec−2 was used to display the masked galaxy image, the surface brightness profiles, and the model images. For the residual images a range of −1 to 1 mag arcsec−2 was used instead.
Current usage metrics show cumulative count of Article Views (full-text article views including HTML views, PDF and ePub downloads, according to the available data) and Abstracts Views on Vision4Press platform.
Data correspond to usage on the plateform after 2015. The current usage metrics is available 48-96 hours after online publication and is updated daily on week days.
Initial download of the metrics may take a while.