Fig. 16.
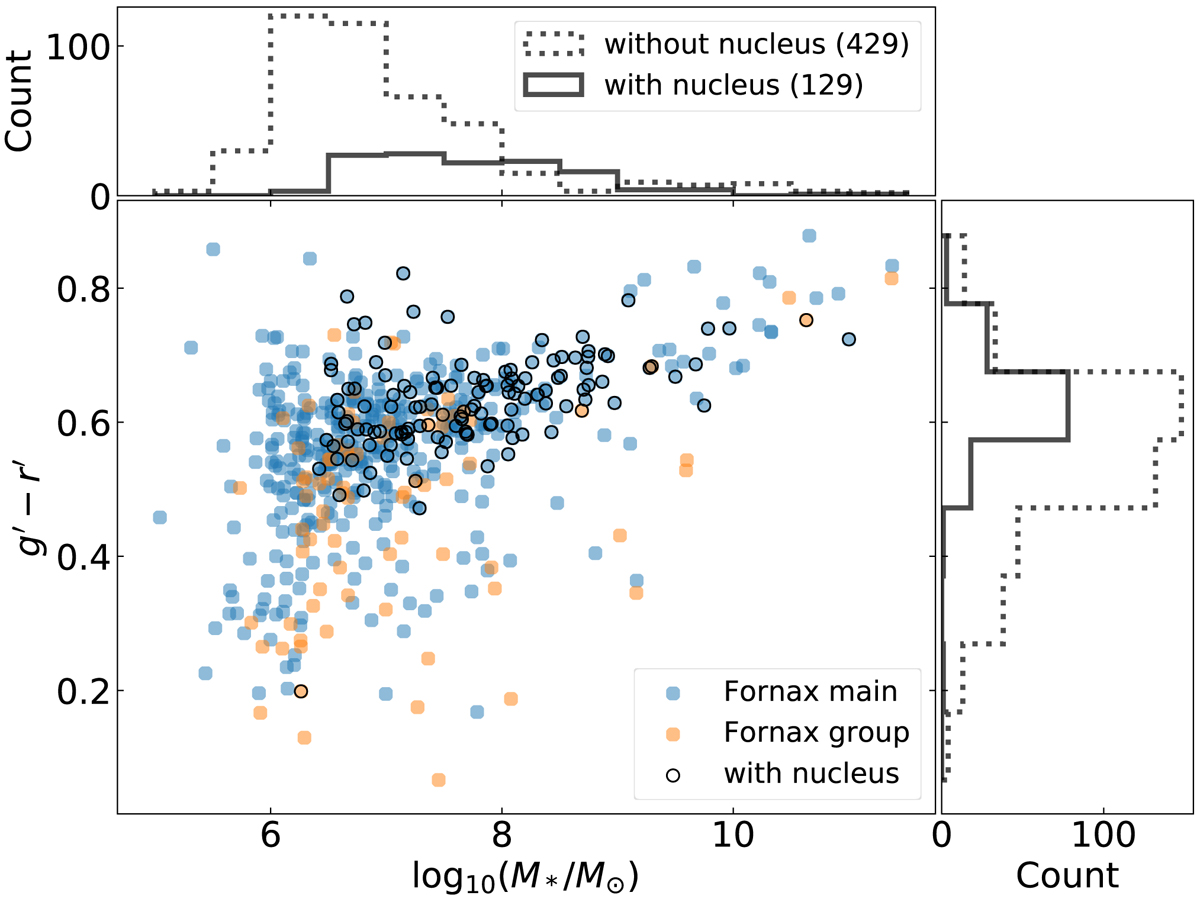
g′−r′ colour as a function of stellar mass for Fornax main (blue) and Fornax group (orange). Galaxies with a nucleus are highlighted with a black circle. The upper and right panels show the distributions of stellar mass and g′−r′ colour, respectively, for galaxies with (bold) and without (dashed) a nucleus. Bins of 0.5 dex and 0.1 mag were used for the stellar mass and g′−r′ colour, respectively.
Current usage metrics show cumulative count of Article Views (full-text article views including HTML views, PDF and ePub downloads, according to the available data) and Abstracts Views on Vision4Press platform.
Data correspond to usage on the plateform after 2015. The current usage metrics is available 48-96 hours after online publication and is updated daily on week days.
Initial download of the metrics may take a while.