Fig. 15.
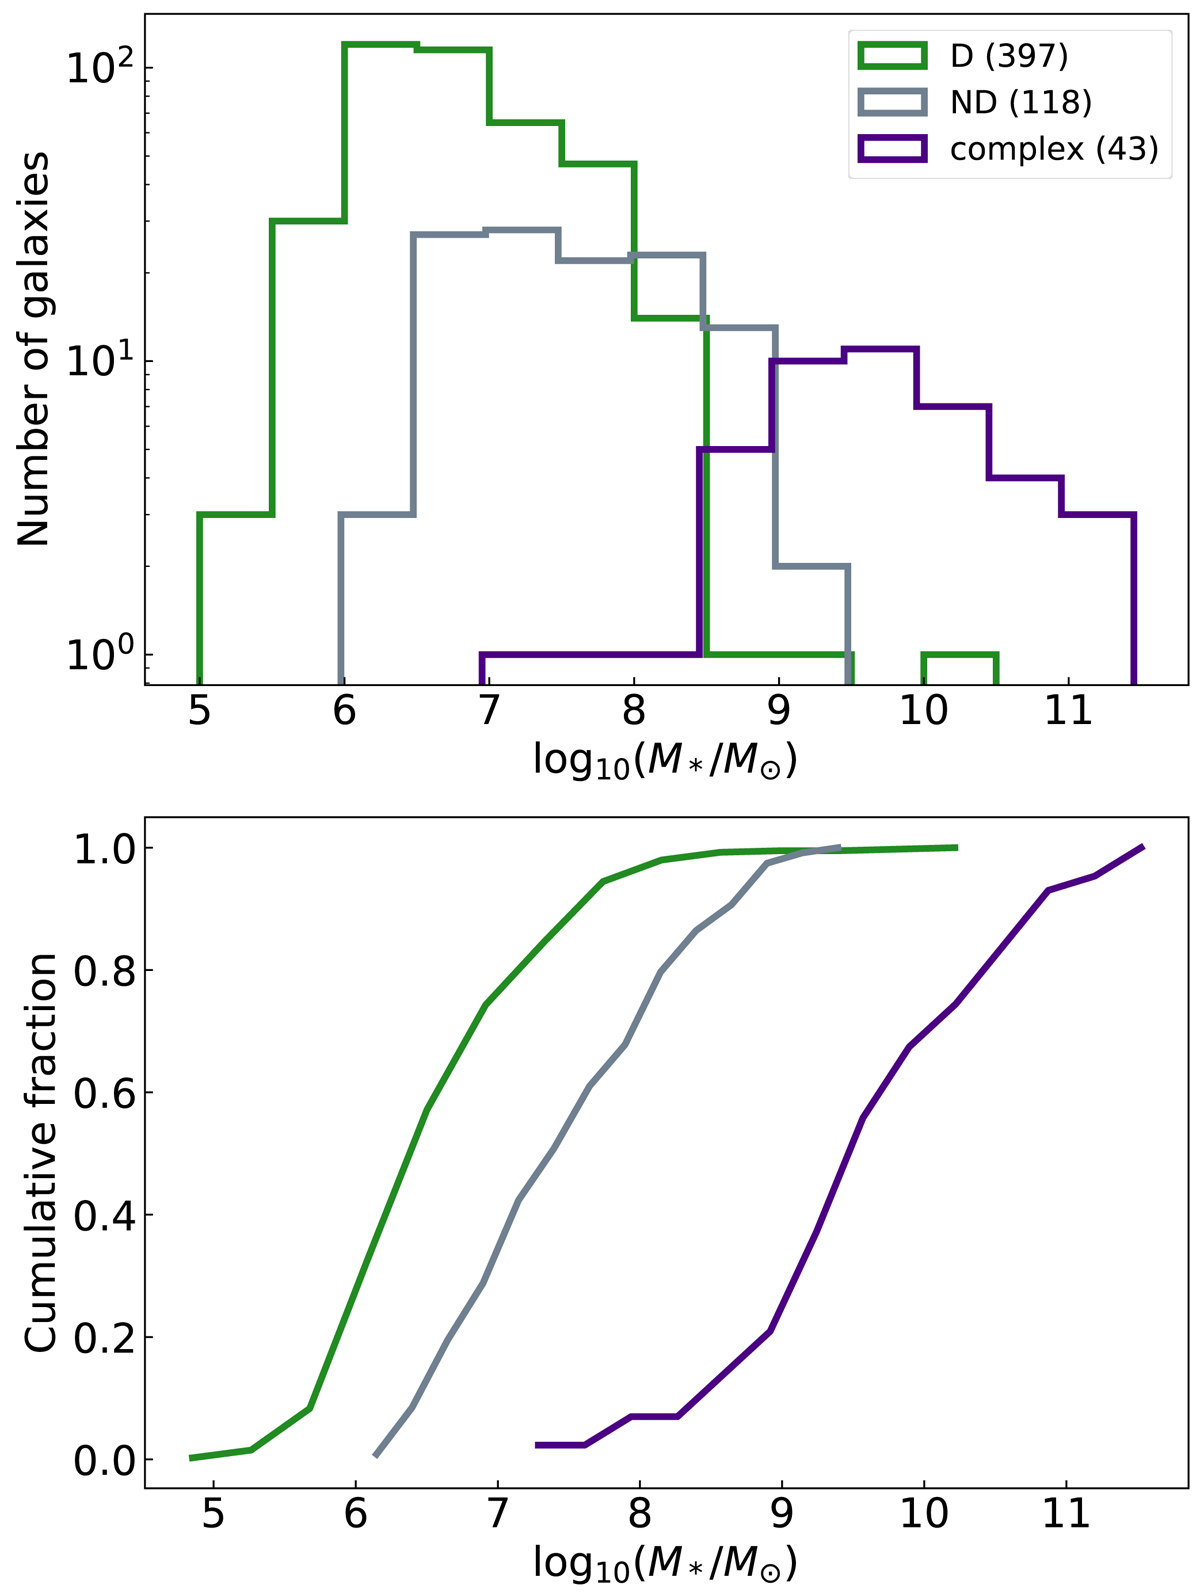
Overview of the multi-component decomposition models of our sample galaxies, split between purely disk (D, green), nucleus+disk (ND, grey), and galaxies with more complex models (complex, purple). The upper and lower panels show the histograms and relative cumulative distributions, respectively, of the three sub-samples. For better readability, we shifted the ND and complex histograms by 0.025 and 0.05, respectively, to the left. No such shifts were applied to the cumulative distributions. A bin size of 0.5 dex was used.
Current usage metrics show cumulative count of Article Views (full-text article views including HTML views, PDF and ePub downloads, according to the available data) and Abstracts Views on Vision4Press platform.
Data correspond to usage on the plateform after 2015. The current usage metrics is available 48-96 hours after online publication and is updated daily on week days.
Initial download of the metrics may take a while.