Fig. 14.
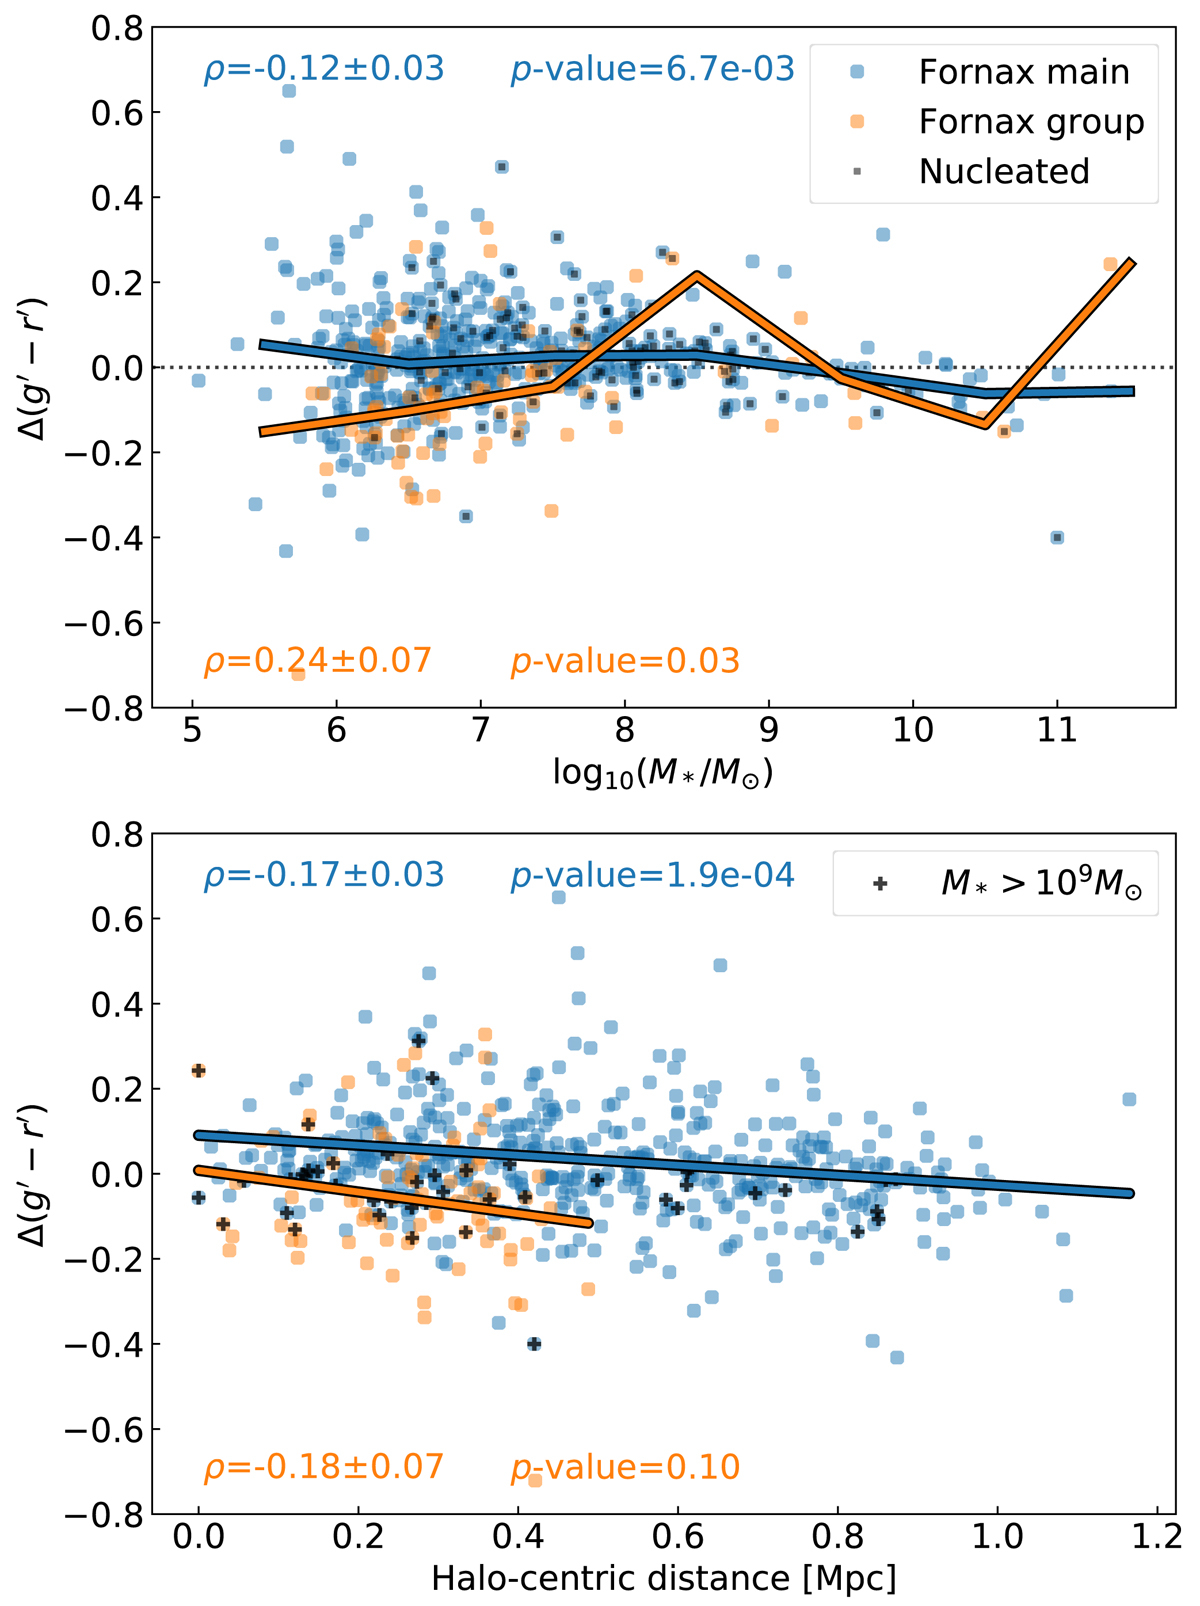
g′−r′ colour differences (defined as the colour of the 1–2Re region minus the inner 0.5Re region, see Eq. (16)) as a function of stellar mass (upper) and halo-centric distance (lower), split between Fornax main (blue) and Fornax group (orange). Δ(g′−r′) > 0 implies a redder outer region, whereas Δ(g′−r′) < 0 implies a bluer outer region. The solid coloured lines in the upper plot denote the median values calculated within bins of 1 dex in stellar mass, whereas those in the lower plot show the linear fits. The dotted line denotes Δ(g′−r′) = 0. The Spearman’s ρ and corresponding p-values for Fornax main and Fornax group are annotated in the plots. The KS-test for Δ(g′−r′) between Fornax main and Fornax group provided a p-value = 8.7 × 10⁻¹⁰.
Current usage metrics show cumulative count of Article Views (full-text article views including HTML views, PDF and ePub downloads, according to the available data) and Abstracts Views on Vision4Press platform.
Data correspond to usage on the plateform after 2015. The current usage metrics is available 48-96 hours after online publication and is updated daily on week days.
Initial download of the metrics may take a while.