Fig. 13.
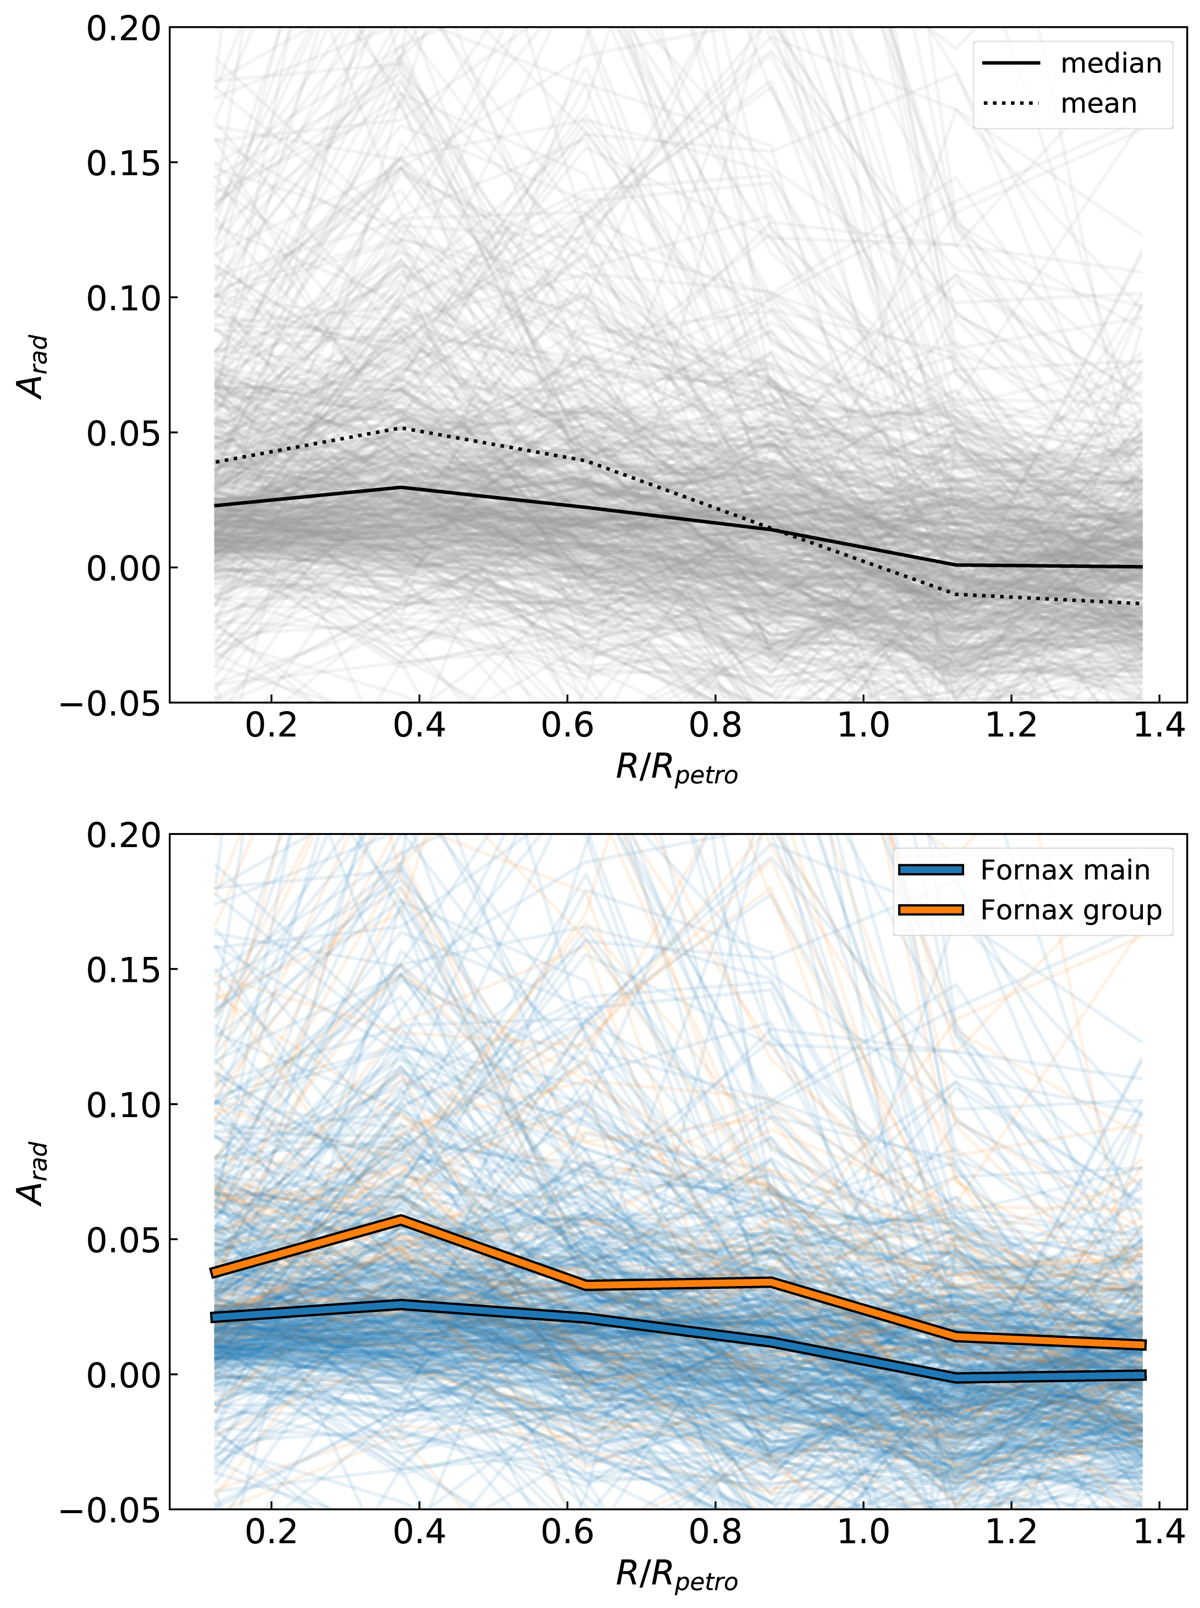
Asymmetry index as a function of radius for all galaxies (Arad). Upper panel: asymmetry profiles for all galaxies (grey). The black solid and dashed lines indicate the median and mean values, respectively, of asymmetry at fixed factors of Petrosian radius. Lower panel: asymmetry profiles split between Fornax main (blue) and Fornax group (orange). The coloured solid lines show the median values of asymmetry at a given factor of the Petrosian radius.
Current usage metrics show cumulative count of Article Views (full-text article views including HTML views, PDF and ePub downloads, according to the available data) and Abstracts Views on Vision4Press platform.
Data correspond to usage on the plateform after 2015. The current usage metrics is available 48-96 hours after online publication and is updated daily on week days.
Initial download of the metrics may take a while.