Fig. 11.
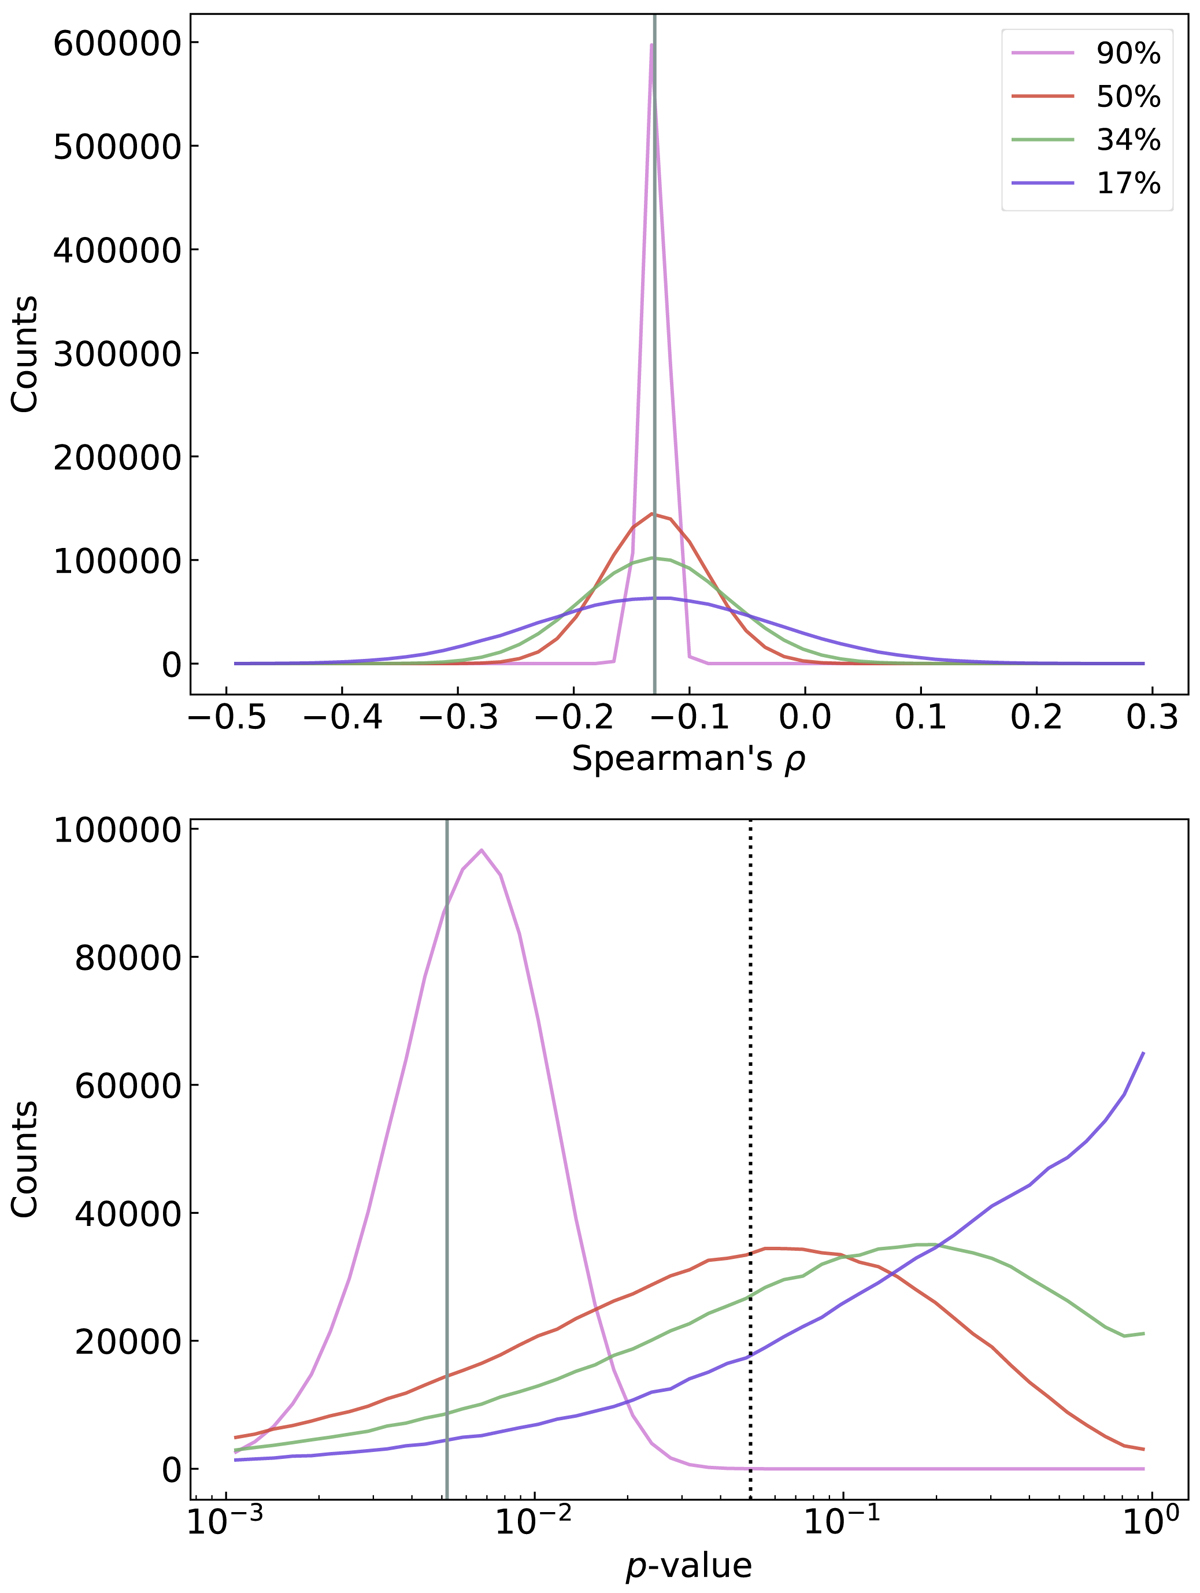
Distributions of Spearman’s ρ (upper) and the corresponding p-values (lower) from residual ![]() and cluster-centric distance, based on 90% (lilac), 50% (orangered), 34% (pale green), and 17% (indigo) of the Fornax main sample. The vertical grey lines denote the Spearman’s ρ and p-value from the whole Fornax main sample (i.e. from Fig. 10). The dotted black line shows the α = 0.05 significance level.
and cluster-centric distance, based on 90% (lilac), 50% (orangered), 34% (pale green), and 17% (indigo) of the Fornax main sample. The vertical grey lines denote the Spearman’s ρ and p-value from the whole Fornax main sample (i.e. from Fig. 10). The dotted black line shows the α = 0.05 significance level.
Current usage metrics show cumulative count of Article Views (full-text article views including HTML views, PDF and ePub downloads, according to the available data) and Abstracts Views on Vision4Press platform.
Data correspond to usage on the plateform after 2015. The current usage metrics is available 48-96 hours after online publication and is updated daily on week days.
Initial download of the metrics may take a while.