Fig. 10.
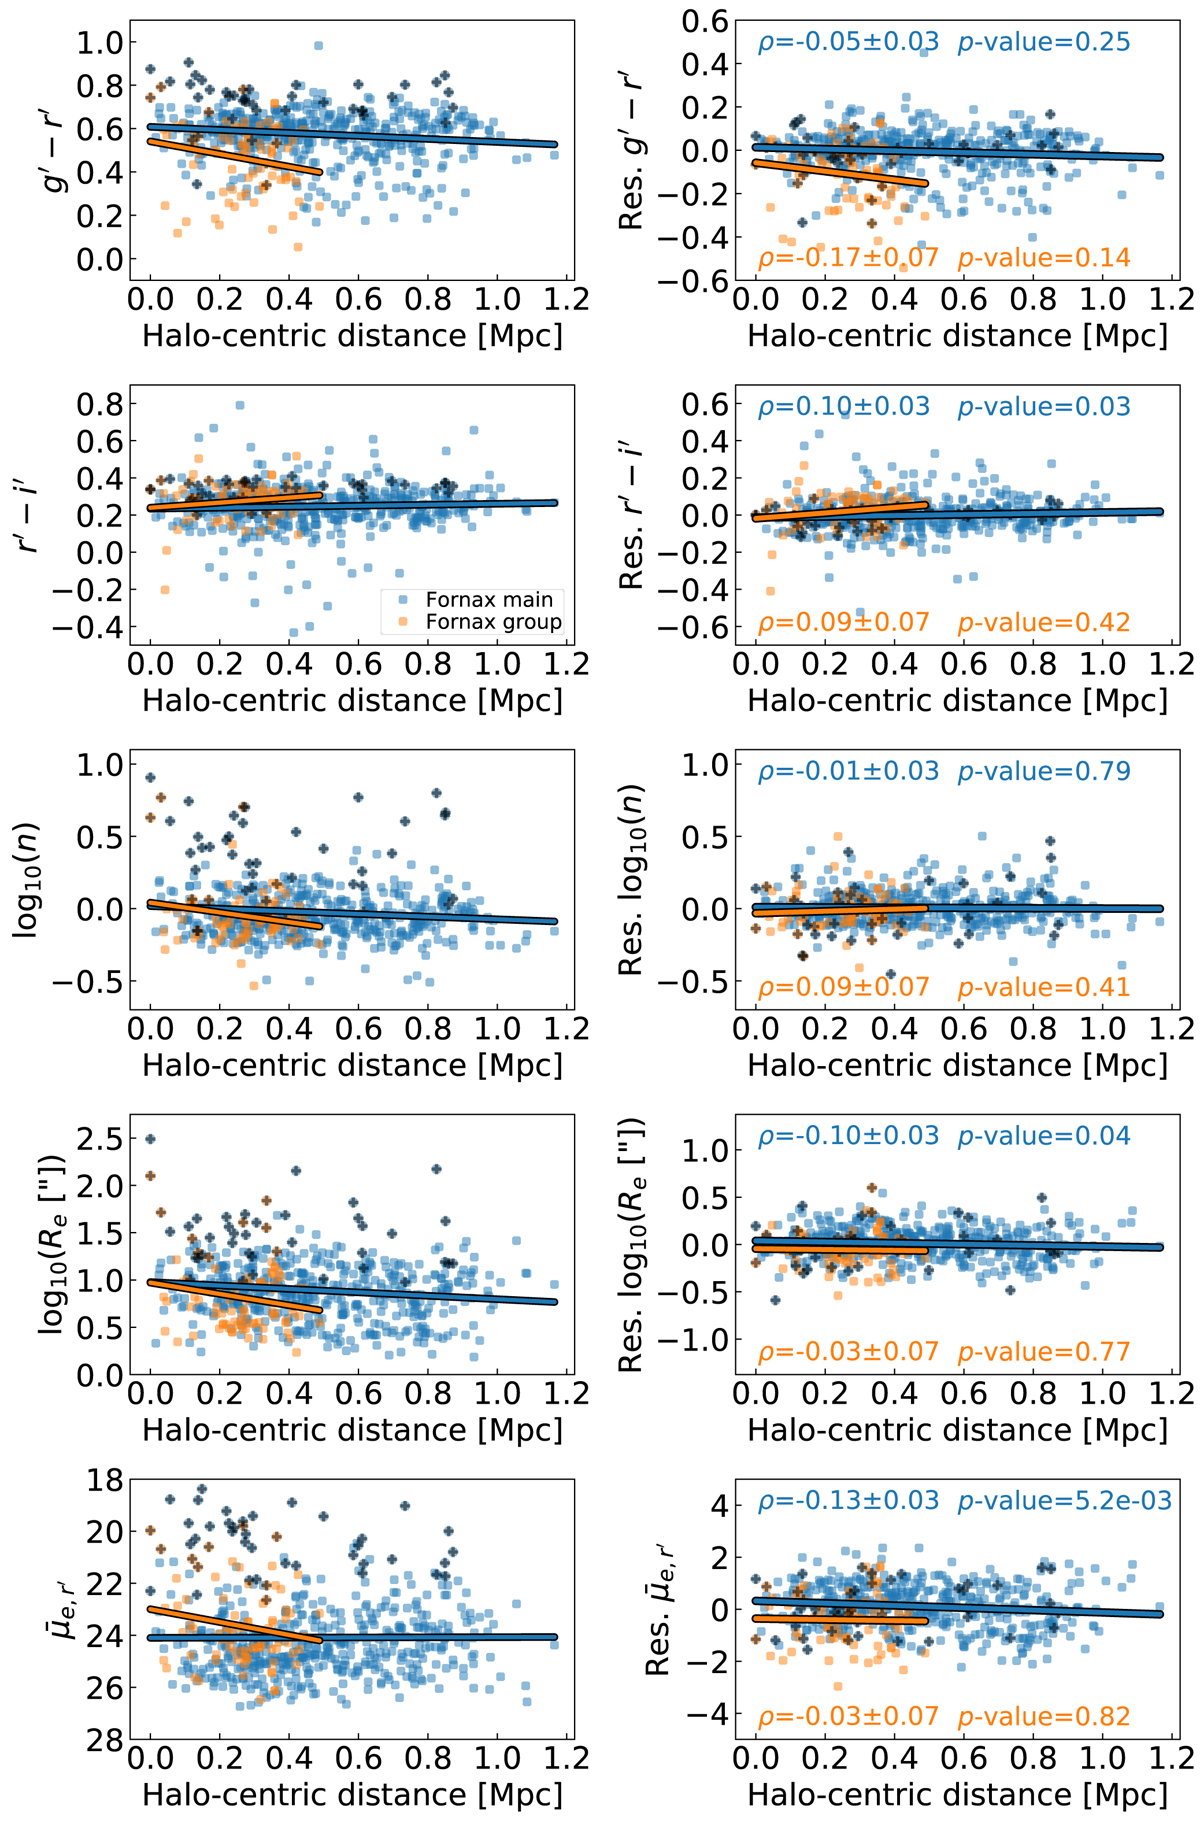
Measured (left) and residual (right) Sérsic-derived quantities as a function of projected halo-centric distance. The coloured lines denote the linear fits to the sub-samples. The residual parameters are defined as the mass-trend subtracted parameter values. Galaxies with log10(M*/M⊙) > 9 are also marked with a black cross. The Spearman’s ρ rank coefficient and the p-value are annotated in the subplots. We use the same y-axes range between the corresponding measured and residual quantities to highlight the reduction in scatter.
Current usage metrics show cumulative count of Article Views (full-text article views including HTML views, PDF and ePub downloads, according to the available data) and Abstracts Views on Vision4Press platform.
Data correspond to usage on the plateform after 2015. The current usage metrics is available 48-96 hours after online publication and is updated daily on week days.
Initial download of the metrics may take a while.