Fig. 8.
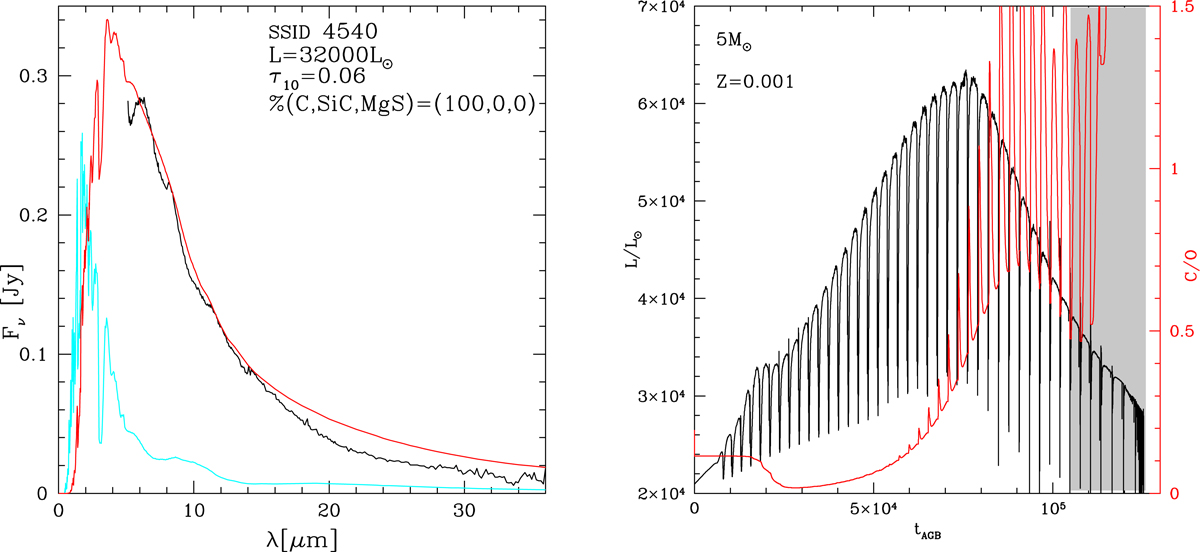
Left: IRS SED of source SSID 4540, compared with our interpretation, based on synthetic modelling. Right: AGB evolution with time of the luminosity (black line, scale on the left) and of the surface C/O ratio (red line, scale on the right) of a 5 M⊙ model with metallicity Z = 0.001. The grey shaded area indicates the evolutionary phase during which the star evolves as a carbon star.
Current usage metrics show cumulative count of Article Views (full-text article views including HTML views, PDF and ePub downloads, according to the available data) and Abstracts Views on Vision4Press platform.
Data correspond to usage on the plateform after 2015. The current usage metrics is available 48-96 hours after online publication and is updated daily on week days.
Initial download of the metrics may take a while.