Free Access
Fig. 7.
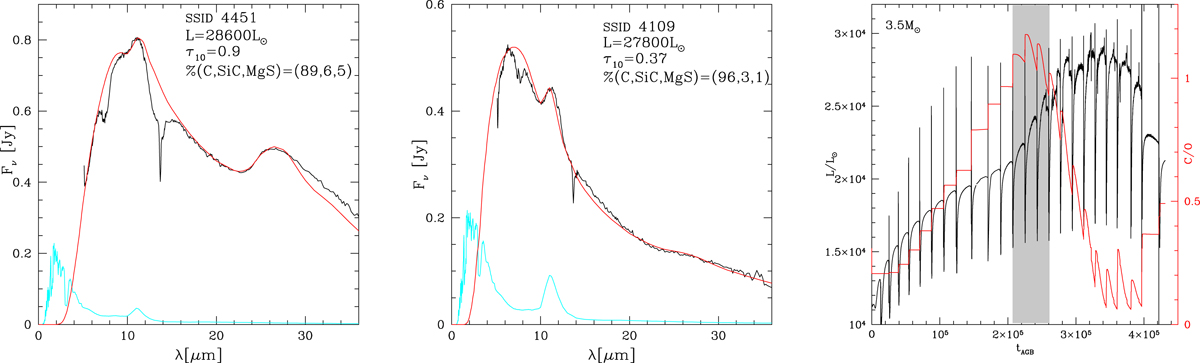
IRS and best-fit SED for sources SSID 4451 (left panel) and SSID 4109 (middle). Right: evolution with time (counted since the beginning of the TP-AGB phase) of luminosity (black) and surface C/O (red track, scale on the right) of a 3.5 M⊙ star. The grey shaded area indicates the phase during which the star is carbon-rich.
Current usage metrics show cumulative count of Article Views (full-text article views including HTML views, PDF and ePub downloads, according to the available data) and Abstracts Views on Vision4Press platform.
Data correspond to usage on the plateform after 2015. The current usage metrics is available 48-96 hours after online publication and is updated daily on week days.
Initial download of the metrics may take a while.