Fig. 6.
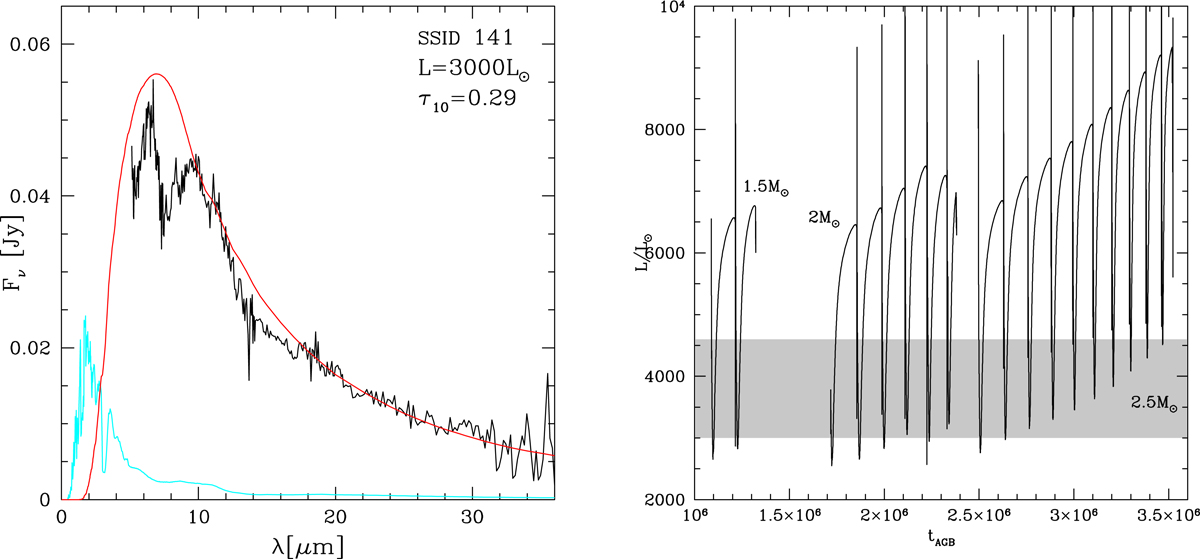
Left: IRS SED of source SSID 141, compared with our interpretation based on synthetic modelling. Right: AGB evolution with time of the luminosity of 1.5, 2, 2.5 M⊙ stars; the O-rich phase was omitted for readability. The sequence of the 2.5 M⊙ was artificially shifted by 1 Myr for readability. The grey shaded region indicates the luminosity range of the low-luminosity stars SSID 3, SSID 66, SSID 103, and SSID 141.
Current usage metrics show cumulative count of Article Views (full-text article views including HTML views, PDF and ePub downloads, according to the available data) and Abstracts Views on Vision4Press platform.
Data correspond to usage on the plateform after 2015. The current usage metrics is available 48-96 hours after online publication and is updated daily on week days.
Initial download of the metrics may take a while.