Fig. 5.
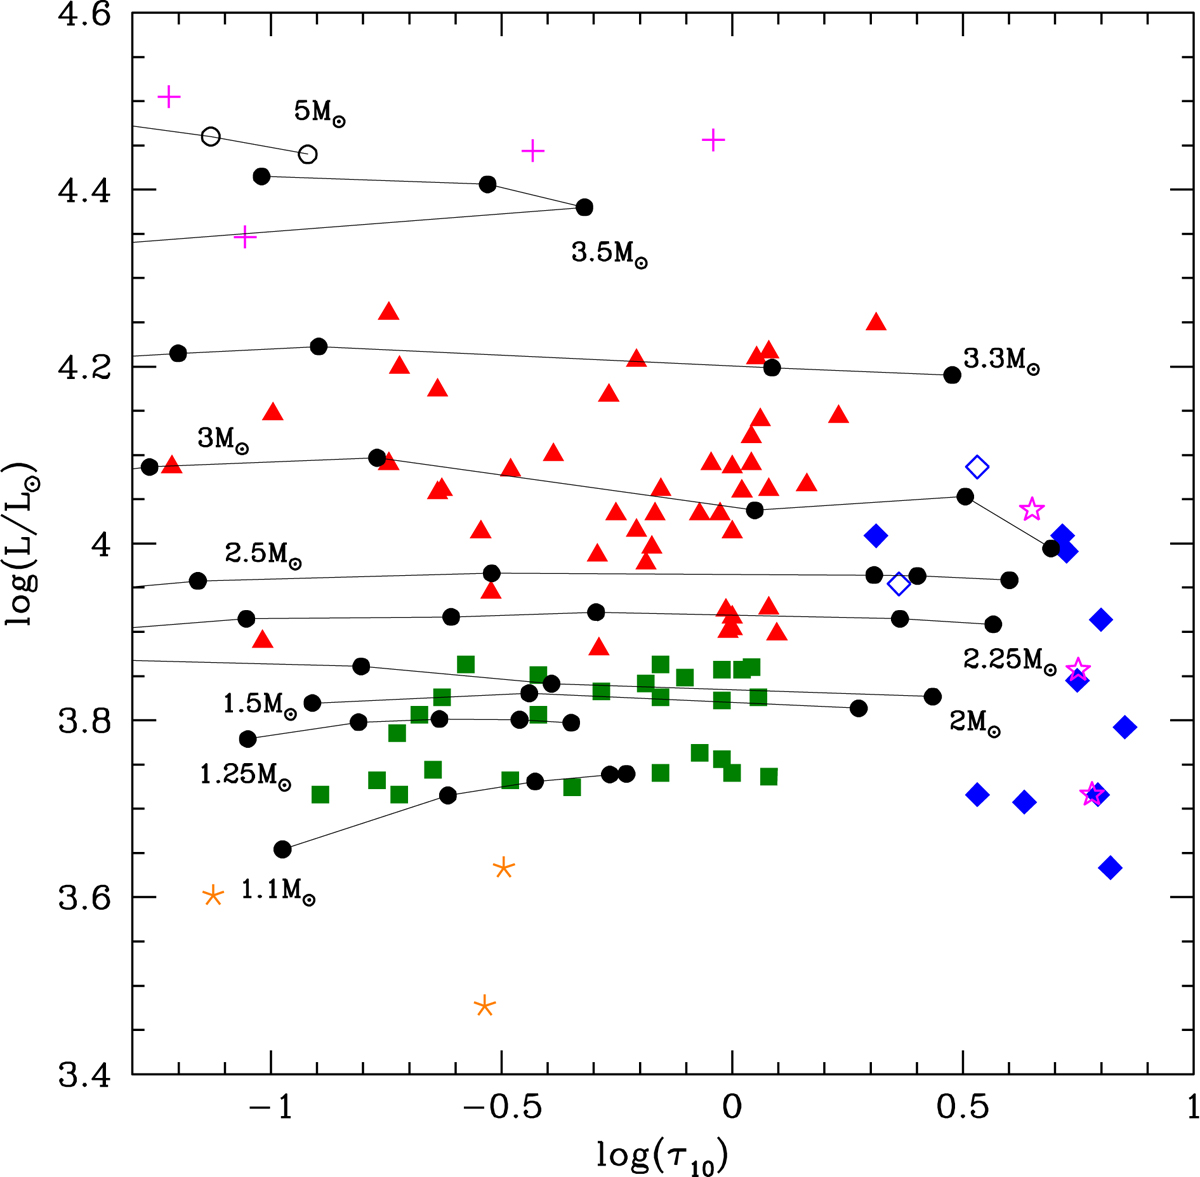
Luminosities and optical depths derived for the stars in the sample analysed in the present work. Green squares and red triangles indicate the progeny of M < 2 M⊙ stars and the higher mass counterpart, respectively; orange asterisks refer to stars with luminosities below 5000 L⊙; magenta crosses indicate stars brighter than 20 000 L⊙; blue diamonds indicate extremely obscured objects, which were taken from Gruendl et al. (2008) and the source SSID 9; and the stars indicated with open diamonds are SSID 125 and SSID 190. The black lines and points in the figure refer to the evolution of the same models shown in Fig. 3, and the initial masses are indicated next to the corresponding track. Magenta stars indicate the results obtained by artificially increasing the mass-loss rate of the stars of initial masses 1.1 M⊙, 2.5 M⊙, 3 M⊙, after reaching the C-star stage, according to the discussion in Sect. 5.3.
Current usage metrics show cumulative count of Article Views (full-text article views including HTML views, PDF and ePub downloads, according to the available data) and Abstracts Views on Vision4Press platform.
Data correspond to usage on the plateform after 2015. The current usage metrics is available 48-96 hours after online publication and is updated daily on week days.
Initial download of the metrics may take a while.