Fig. 4.
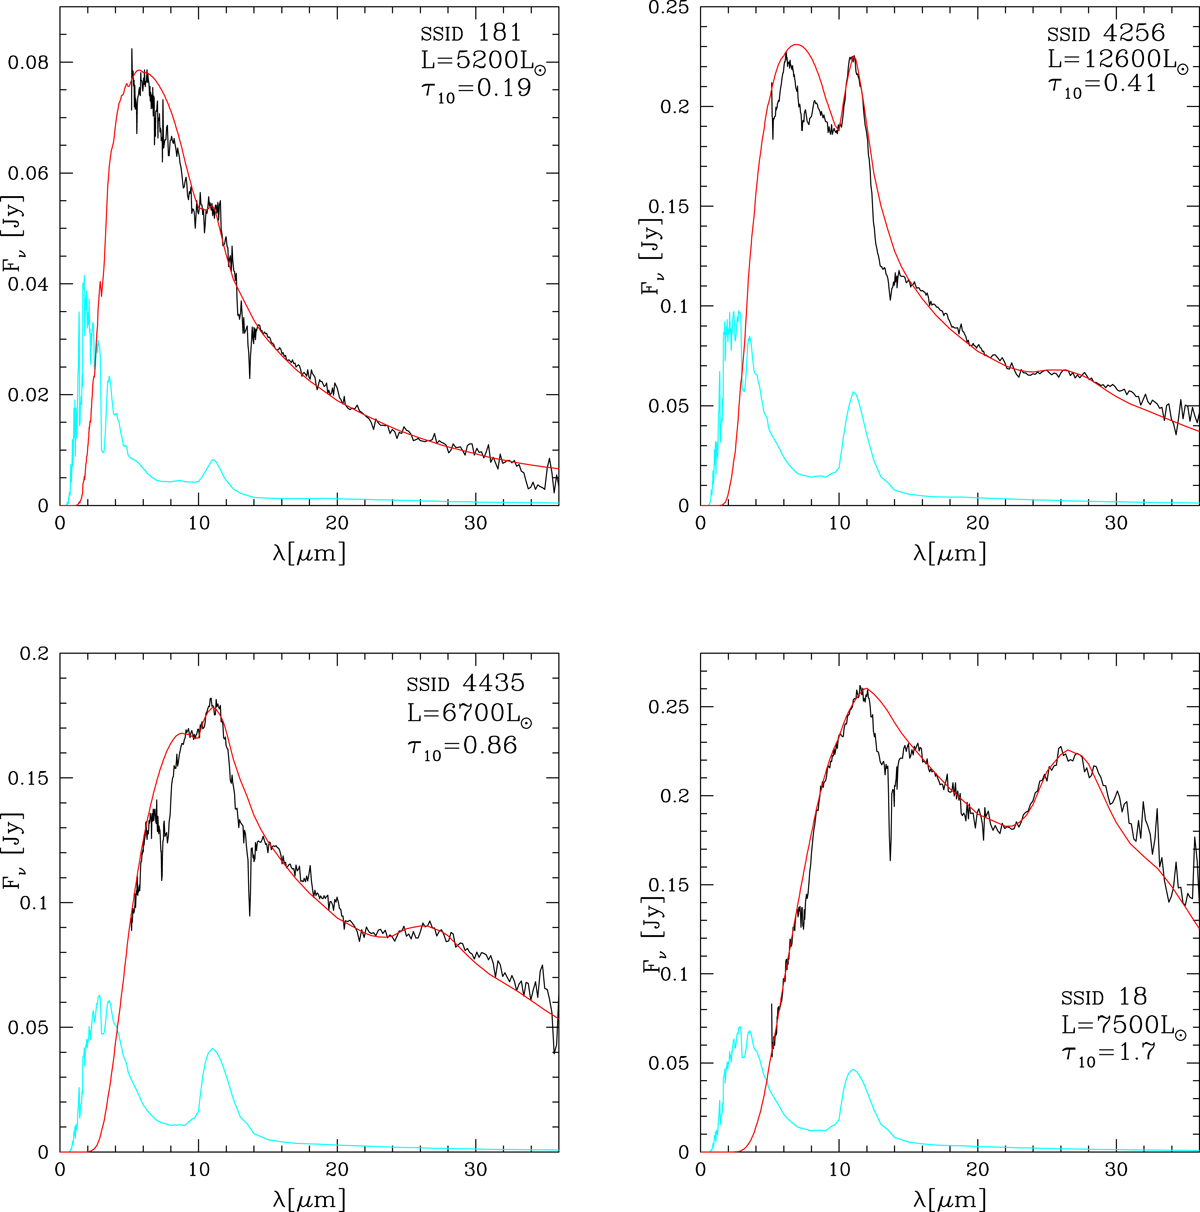
Comparison between the IRS (black lines) and the synthetic (red) spectra of a few sources in the LMC sample of carbon stars, with various luminosities and degrees of obscuration. The values of luminosities and τ10 reported in each panel are those allowing the best fit, corresponding to the red lines. The cyan lines indicate the synthetic SED entering the carbon condensation zone, resulting from the absorption of the radiation from the photosphere by SiC particles in the innermost region of the circumstellar envelope.
Current usage metrics show cumulative count of Article Views (full-text article views including HTML views, PDF and ePub downloads, according to the available data) and Abstracts Views on Vision4Press platform.
Data correspond to usage on the plateform after 2015. The current usage metrics is available 48-96 hours after online publication and is updated daily on week days.
Initial download of the metrics may take a while.