Fig. 3.
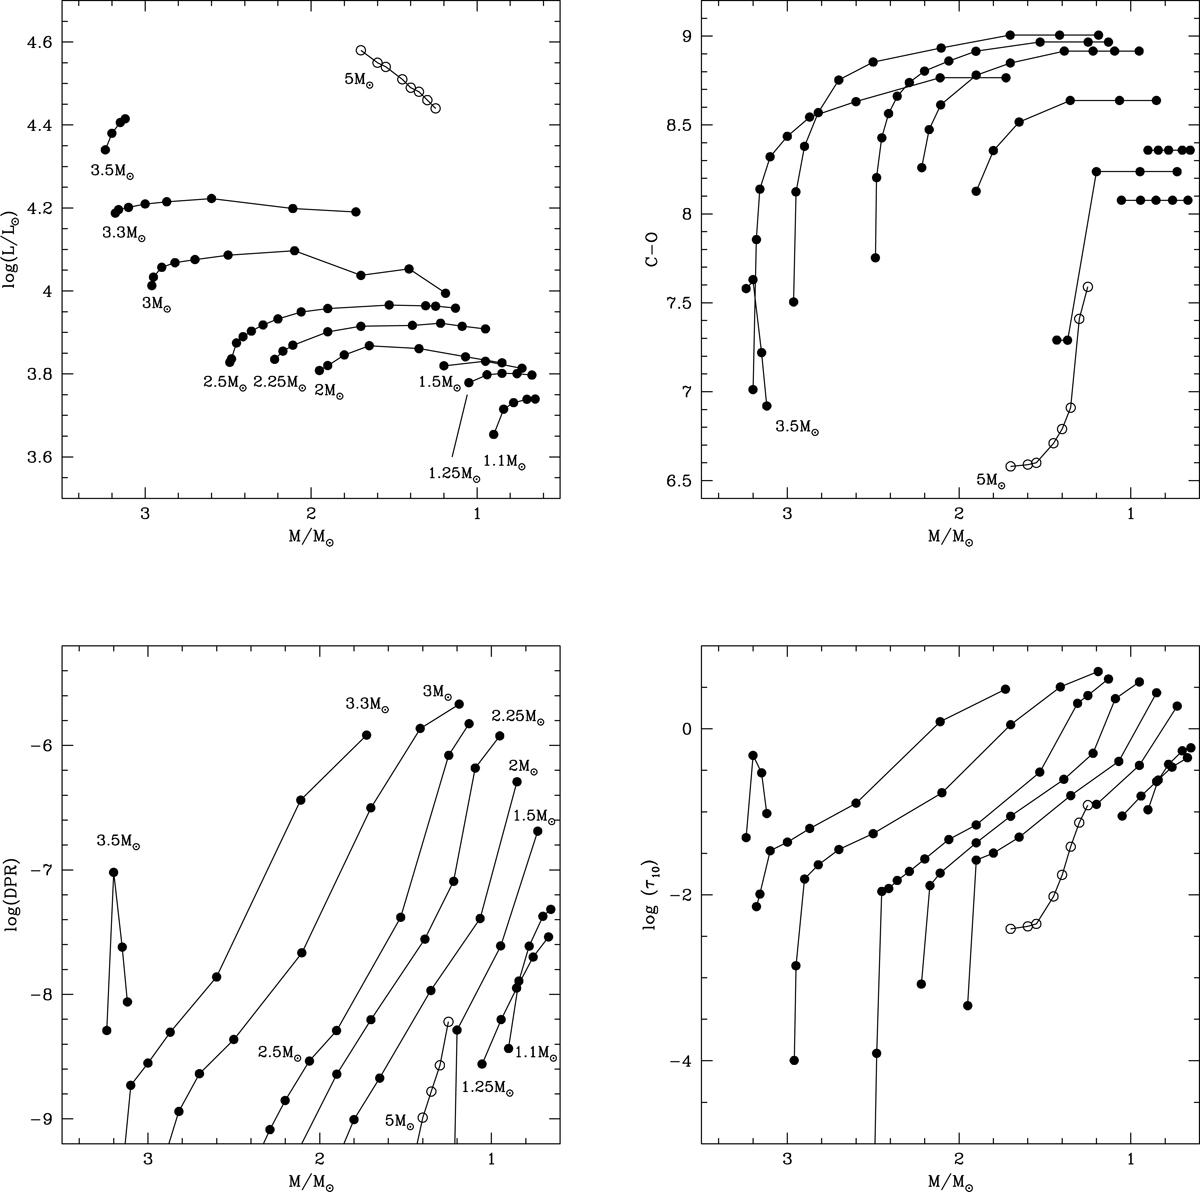
Variation of luminosity (top-left panel), carbon excess C−O (top-right, see text for the definition), dust production rate (bottom-left) and τ10 (bottom-right) of the AGB models used in the present work. The evolutions are shown with respect to the current mass of the star on the abscissa. The different lines connect a few points selected during the evolution trough the C-star phase. Open points refer to the evolution of a 5 M⊙ star of metallicity Z = 0.001
Current usage metrics show cumulative count of Article Views (full-text article views including HTML views, PDF and ePub downloads, according to the available data) and Abstracts Views on Vision4Press platform.
Data correspond to usage on the plateform after 2015. The current usage metrics is available 48-96 hours after online publication and is updated daily on week days.
Initial download of the metrics may take a while.