Fig. 2.
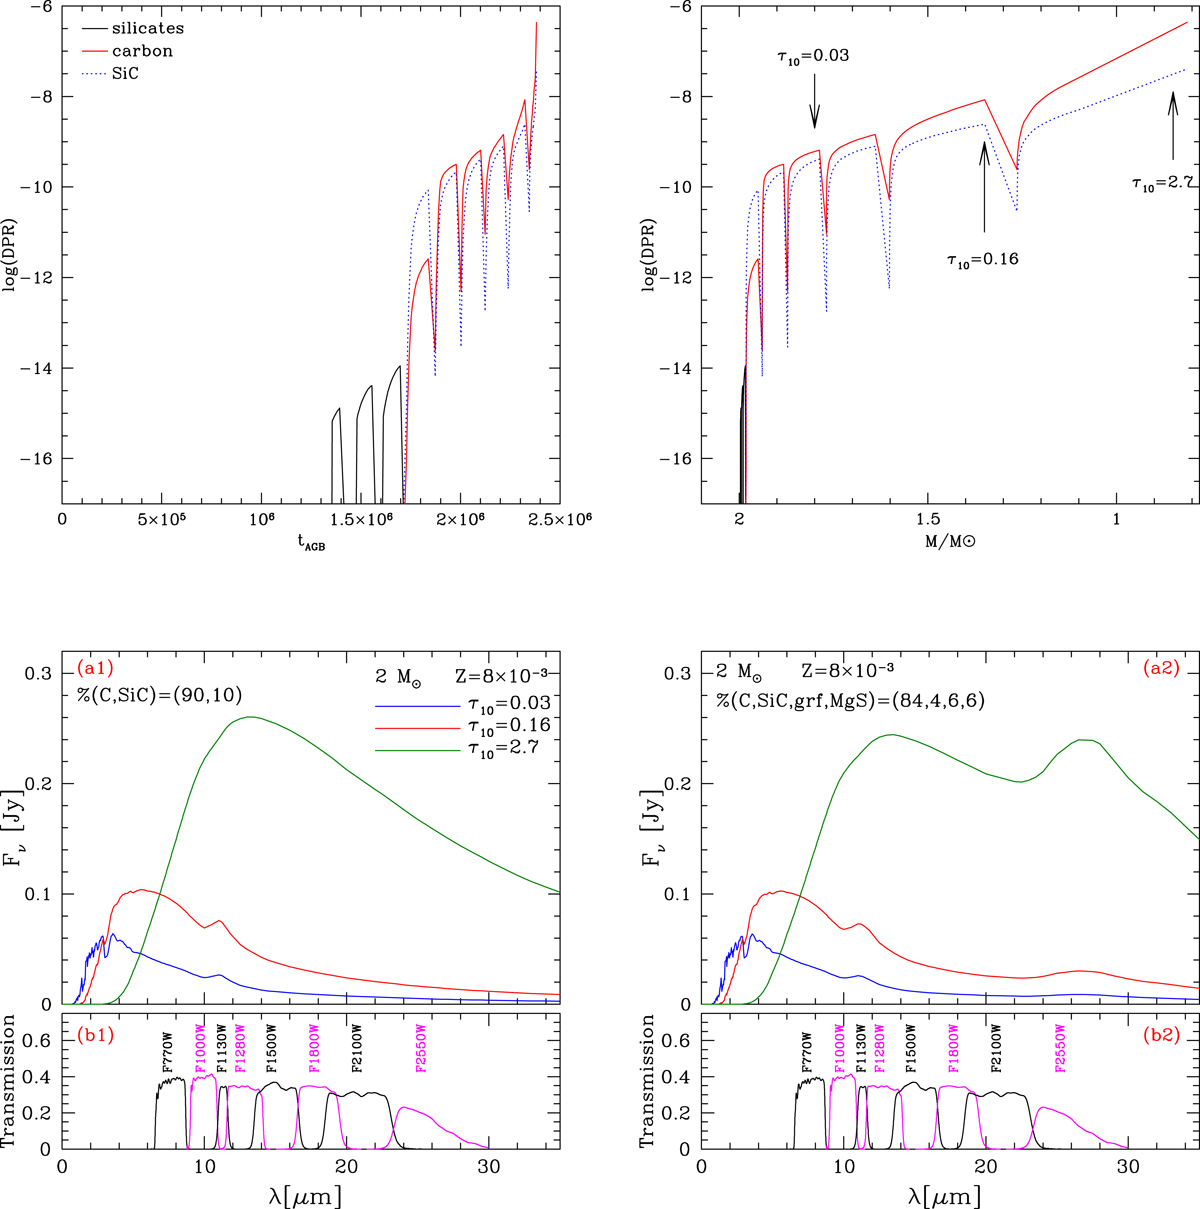
Top panels: variation of the dust production rate as a function of time (left) and of the current mass of the star (right) during the AGB evolution of the model of initial mass 2 M⊙ and metallicity Z = 0.008 presented in Fig. 1. The individual contributions from silicates, solid carbon, and silicon carbide are shown. Bottom panels: variation of the expected SED during four different stages (indicated with the arrows in the top-right panel) when considering only solid carbon and SiC (left), and when graphite and MgS are also considered (right). In these examples, the number density of the seeds of amorphous carbon dust relative to hydrogen is assumed 10−13, whereas the density of the seeds of the other dust species are scaled with respect to amorphous carbon according to the percentages given in the two panels.
Current usage metrics show cumulative count of Article Views (full-text article views including HTML views, PDF and ePub downloads, according to the available data) and Abstracts Views on Vision4Press platform.
Data correspond to usage on the plateform after 2015. The current usage metrics is available 48-96 hours after online publication and is updated daily on week days.
Initial download of the metrics may take a while.