Fig. 16.
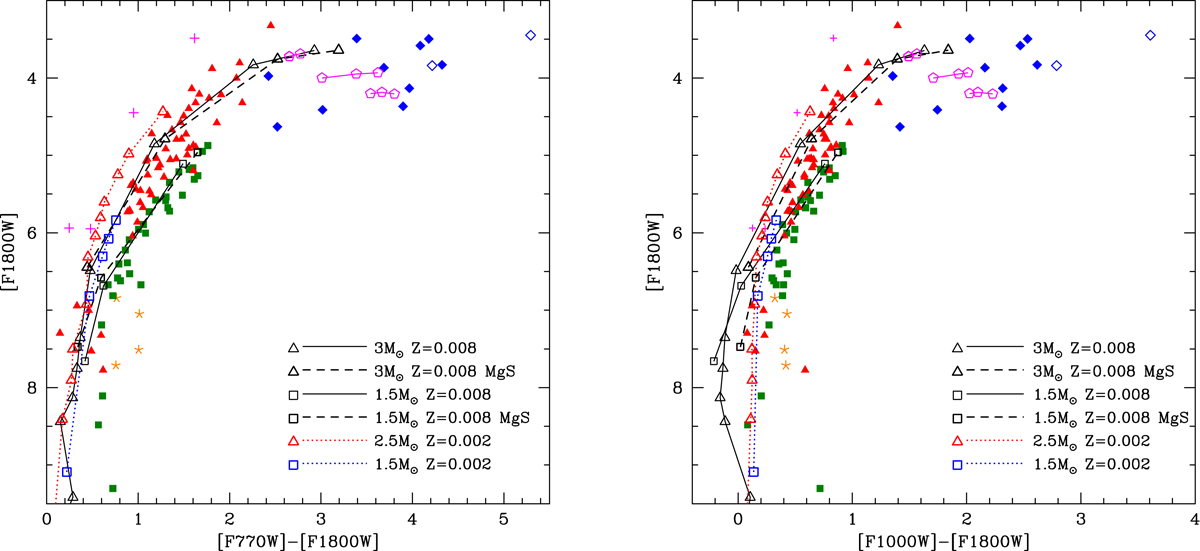
Left: stars in sample described in Sect. 2 are shown in the colour-magnitude ([F770W]–[F1800W], [F1800W]) plane. The same symbols as those in Fig. 5 were adopted. Black squares and triangles indicate the expected evolution of stars of metallicity Z = 0.008 and initial masses 1.5 M⊙ and 3 M⊙, respectively. Dashed lines refer to the expected evolution of 1.5 M⊙ and 3 M⊙ stars, when the presence of Sic+MgS and graphite grains are considered in the computation of the synthetic SED. The blue squares and red triangles, connected with dotted tracks, refer to the evolution of Z = 0.002 stars of initial masses 1.5 M⊙ and 2.5 M⊙, respectively. Magenta pentagons indicate the tracks of 1.1 M⊙, 2.5 M⊙, and 3 M⊙ (from fainter to brighter) models, obtained by artificially increasing the mass loss rate after the jump in the stellar radius caused by the increase in the surface carbon, according to the discussion in Sect. 5.3. Right: distribution of stars in the colour-magnitude ([F1000W]-[F1800W], [F1800W]) plane.
Current usage metrics show cumulative count of Article Views (full-text article views including HTML views, PDF and ePub downloads, according to the available data) and Abstracts Views on Vision4Press platform.
Data correspond to usage on the plateform after 2015. The current usage metrics is available 48-96 hours after online publication and is updated daily on week days.
Initial download of the metrics may take a while.