Fig. 12.
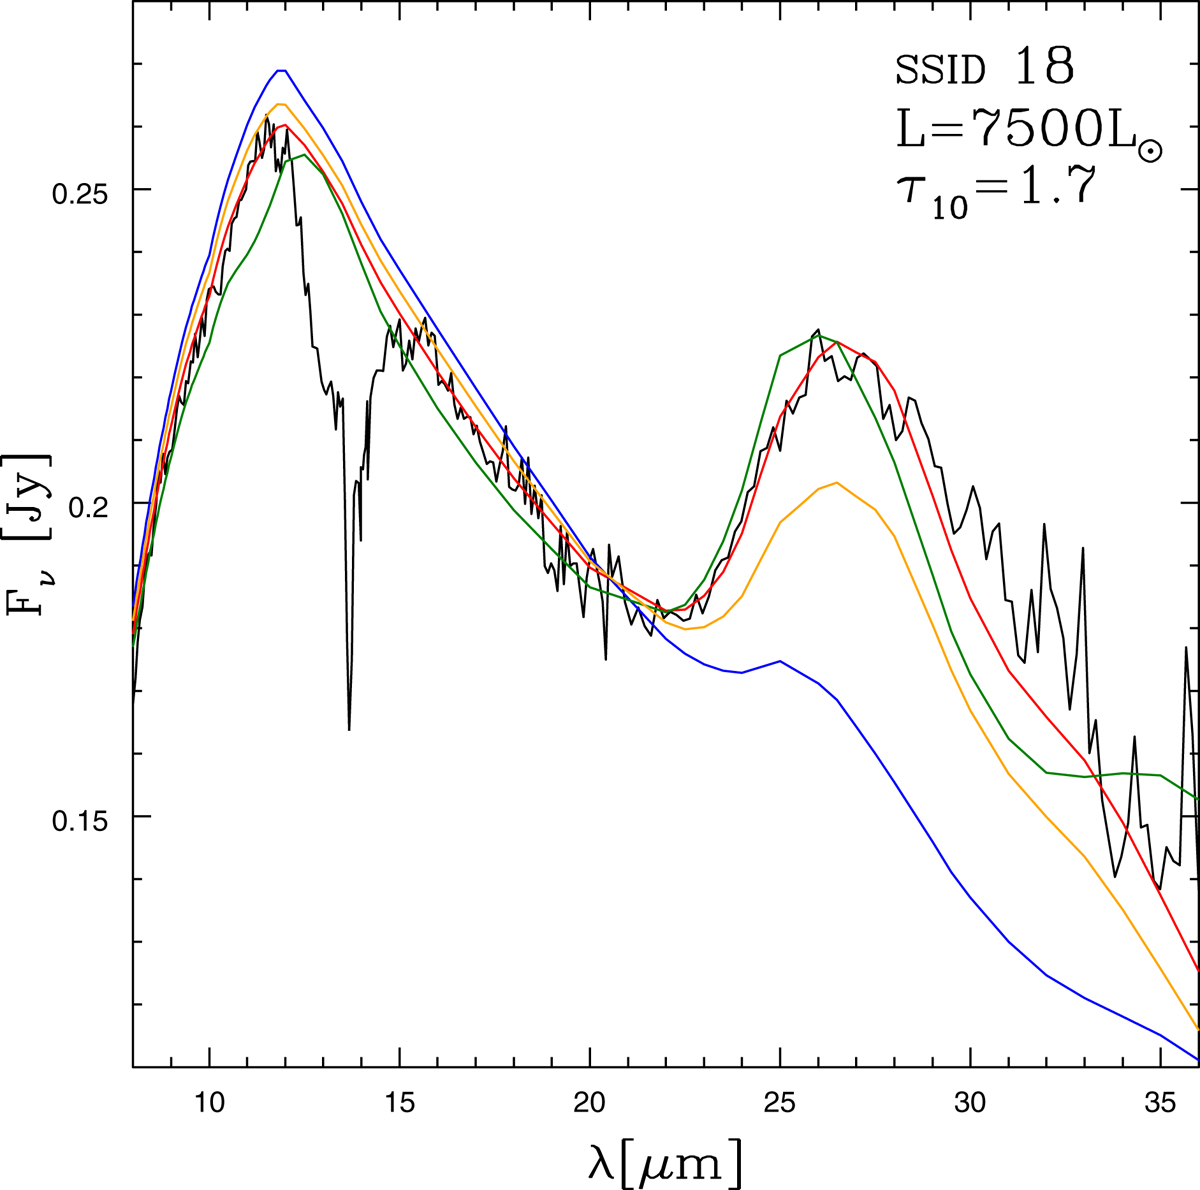
IRS spectrum of SSID 18 (black line) compared with synthetic SEDs, corresponding to the same luminosity and τ10, and different percentages of SiC+MgS and of the relative width of the MgS mantle (aman) on top of SiC core. The various lines correspond to the following: red (our best-fit model), with SiC+MgS = 9% and aman = 0.05 μm; green, with SiC+MgS = 35% and aman = 0.02 μm; blue, with SiC+MgS = 9% and aman = 0.02 μm; and orange, with SiC+MgS = 6% and aman = 0.05 μm.
Current usage metrics show cumulative count of Article Views (full-text article views including HTML views, PDF and ePub downloads, according to the available data) and Abstracts Views on Vision4Press platform.
Data correspond to usage on the plateform after 2015. The current usage metrics is available 48-96 hours after online publication and is updated daily on week days.
Initial download of the metrics may take a while.