Fig. 11.
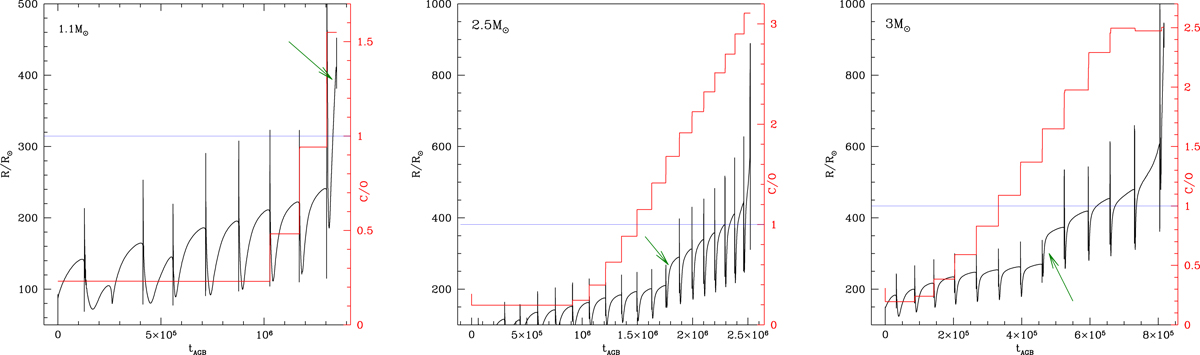
Evolution of radius (black lines, scale on the left) and surface C/O ratio (red, scale on the right) during the AGB phase of stars of initial masses 1.1 M⊙ (left panel), 2.5 M⊙ (middle), and 3 M⊙ (right). The thin, blue horizontal lines indicate the C=O condition, whereas the green arrows indicate the phase of rapid expansion of the star, as a consequence of the surface carbon enrichment.
Current usage metrics show cumulative count of Article Views (full-text article views including HTML views, PDF and ePub downloads, according to the available data) and Abstracts Views on Vision4Press platform.
Data correspond to usage on the plateform after 2015. The current usage metrics is available 48-96 hours after online publication and is updated daily on week days.
Initial download of the metrics may take a while.