Fig. 3
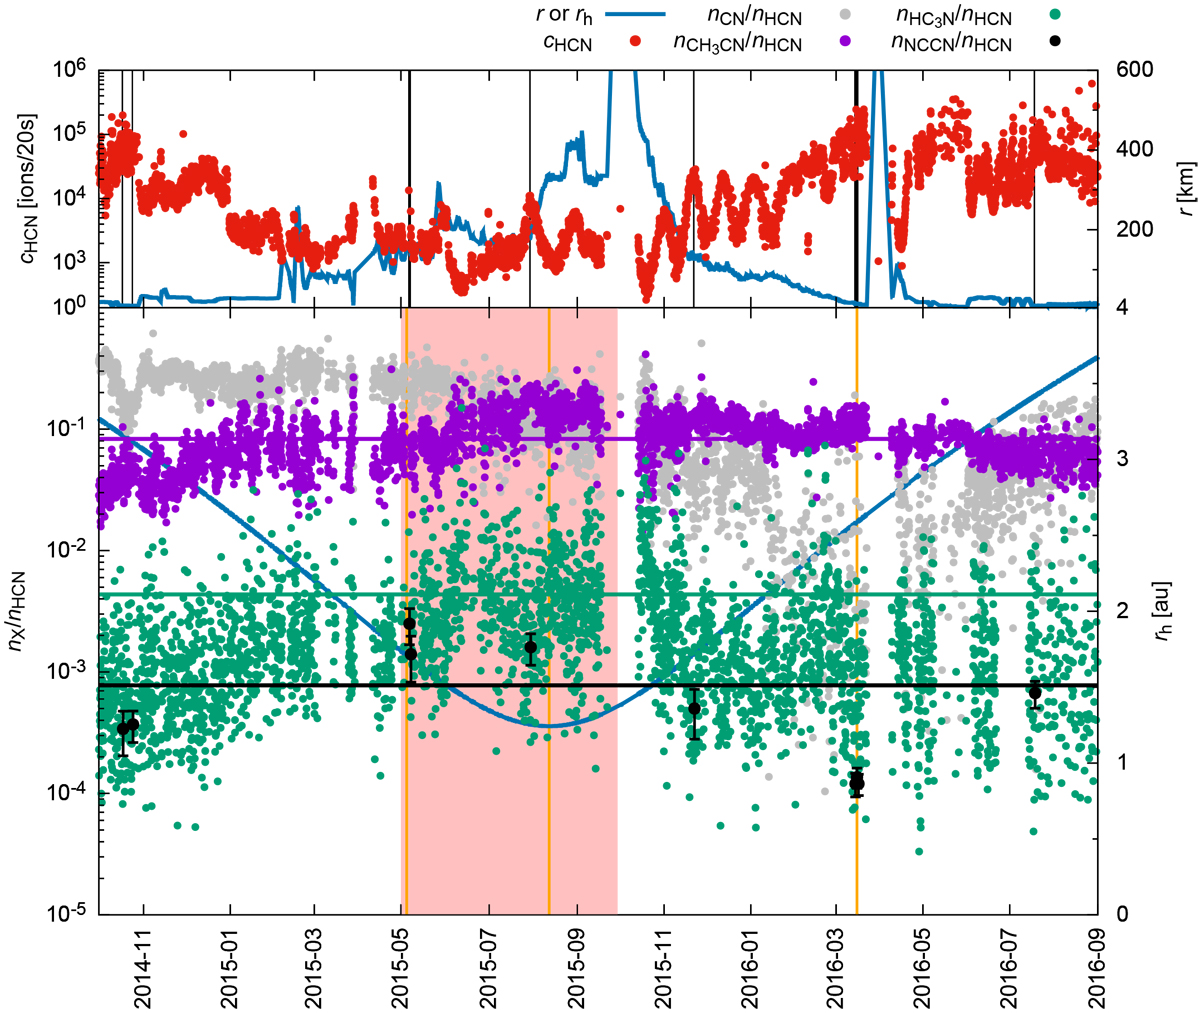
Top: number of ions per spectrum of HCN (cHCN; with 30% error bars and fragmentation not taken into account) during the full Rosetta science mission as derived by Rubin et al. (2019). The cometocentric distance (r) is over-plotted (solid blue line) together with the days when NCCN was found (black vertical bars). Bottom: neutral density ratio of species X with respect to HCN (nX ∕nHCN), where X is CH3CN, HC3 N, NCCN, and CN (from Hänni et al. (2020) for comparison). The respective total mission average values are included as solid horizontal lines for the nitriles investigated in this work. The inbound equinox (5 May 2015), perihelion (13 August 2015), and the outbound equinox (16 March 2016) are indicated (orange vertical bars) together with the heliocentric distance (rh ; solid blue line). The period from May to September 2015 used to derive the close-to-perihelion values in Table 1 is indicated in pale red. The data shown here for cyanogen are also listed in Table B.1. Statistical error bars are omitted for visual clarity (except for NCCN). An impression can be obtained for the case of nCN ∕nHCN from Fig. 4 (top) in Hänni et al. (2020).
Current usage metrics show cumulative count of Article Views (full-text article views including HTML views, PDF and ePub downloads, according to the available data) and Abstracts Views on Vision4Press platform.
Data correspond to usage on the plateform after 2015. The current usage metrics is available 48-96 hours after online publication and is updated daily on week days.
Initial download of the metrics may take a while.