Fig. 2
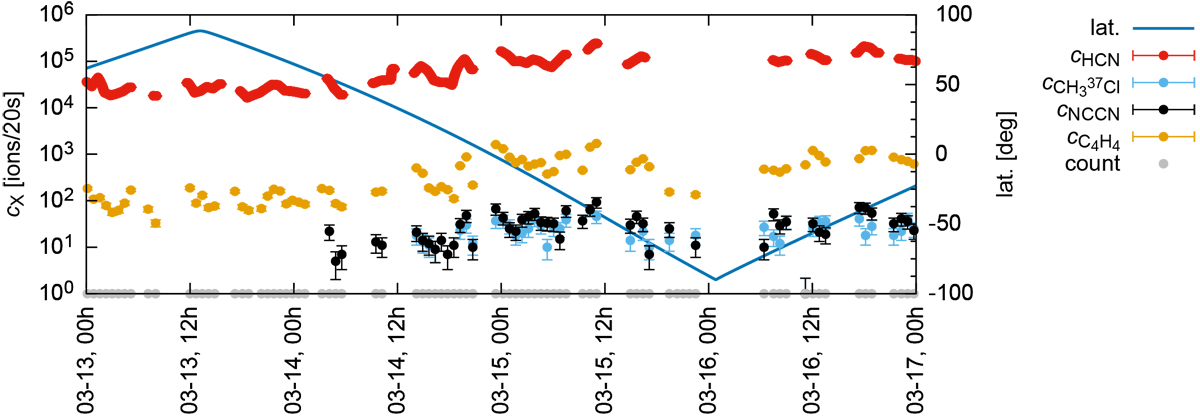
Number of ions per spectrum cX, where X denotes the species observed on mass 52 u/e (i.e., CH3 37 Cl, NCCN, and C4H4). The underlying data were collected in the four days between 13 and 16 March 2016, including the day of the outbound equinox on 16 March 2016. Counting symbols on the x-axis mark times of analyzed spectra. HCN data has been evaluated in an automated data evaluation pipeline and time-interpolated as described in Rubin et al. (2019). Error bars indicate statistical errors.
Current usage metrics show cumulative count of Article Views (full-text article views including HTML views, PDF and ePub downloads, according to the available data) and Abstracts Views on Vision4Press platform.
Data correspond to usage on the plateform after 2015. The current usage metrics is available 48-96 hours after online publication and is updated daily on week days.
Initial download of the metrics may take a while.