Fig. 1
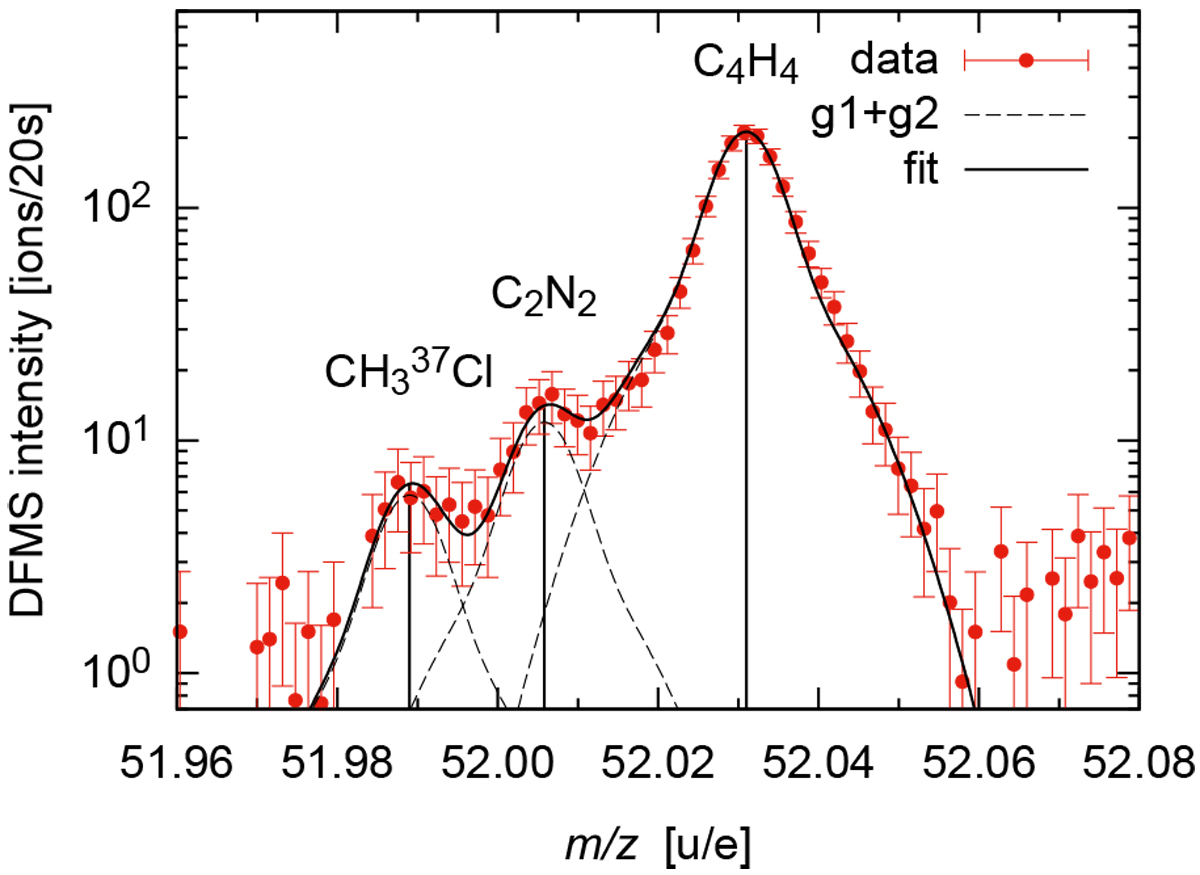
Example mass spectrum collected on 15 March 2016 (10:59 am) of mass 52 u/e –the mass of the molecular ion of NCCN– in the DFMS neutral gas mode. The sum-curve of the two Gaussians (g1+g2) is plotted with a dashed black line for each peak while the overall fit is shown with a solid black line. Error bars indicate statistical error margins.
Current usage metrics show cumulative count of Article Views (full-text article views including HTML views, PDF and ePub downloads, according to the available data) and Abstracts Views on Vision4Press platform.
Data correspond to usage on the plateform after 2015. The current usage metrics is available 48-96 hours after online publication and is updated daily on week days.
Initial download of the metrics may take a while.