Fig. 8.
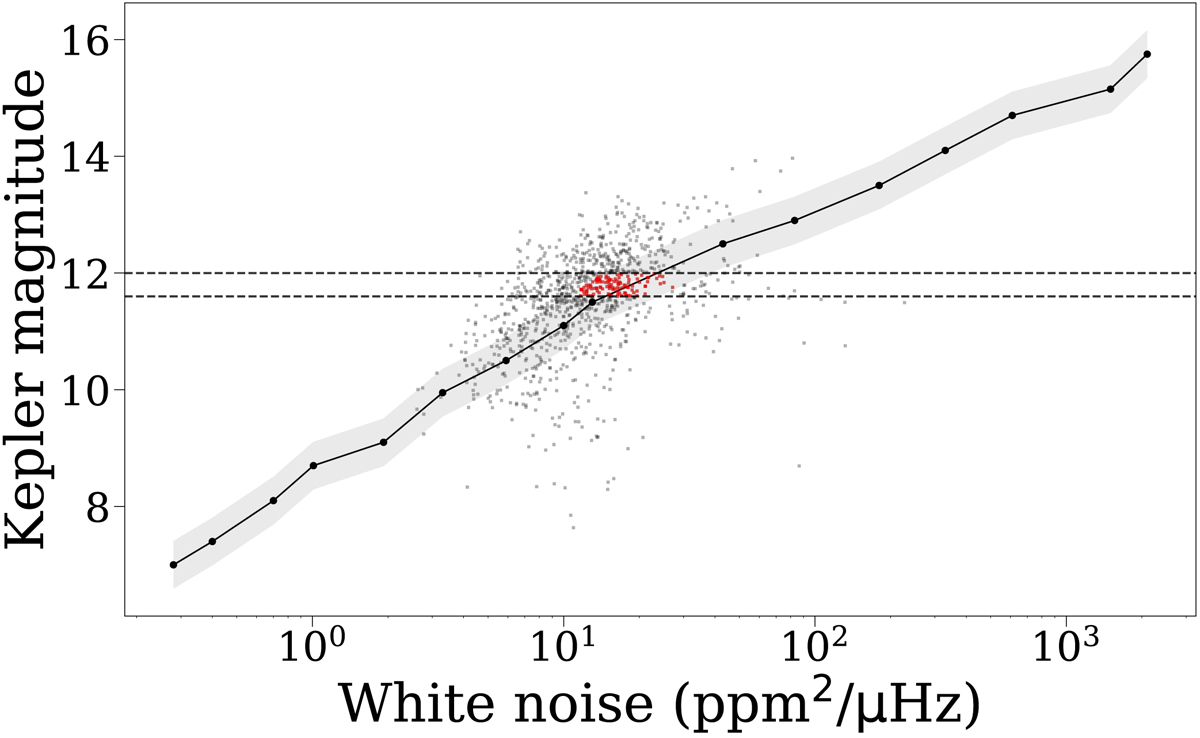
Relation between Kepler magnitude Kp, and white noise. The black solid line represents the relation from Pande et al. (2018), the grey shaded area represents the white noise range corresponding to a variation of 0.4 mag. Our sample is represented by the grey and red dots, where the red dots constitute the sample used in the magnitude analysis, and is identified by the intersection of the horizontal lines with the grey shaded area. The horizontal grey dashed lines show the range of these points within 11.6 mag < Kp < 12 mag.
Current usage metrics show cumulative count of Article Views (full-text article views including HTML views, PDF and ePub downloads, according to the available data) and Abstracts Views on Vision4Press platform.
Data correspond to usage on the plateform after 2015. The current usage metrics is available 48-96 hours after online publication and is updated daily on week days.
Initial download of the metrics may take a while.