Fig. 7.
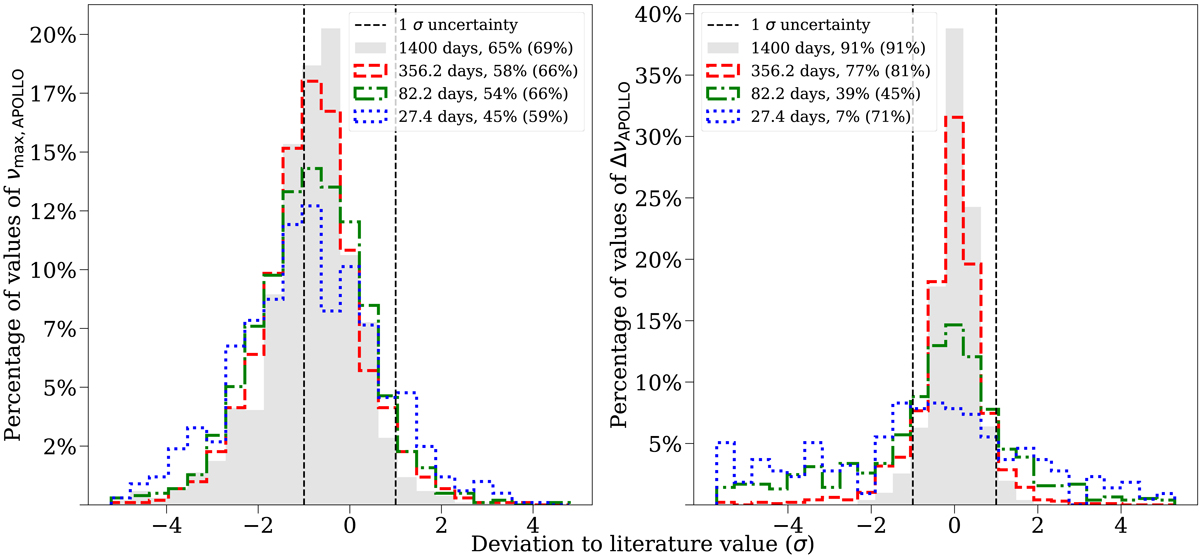
Distribution of values for νmax (left panel) and Δν (right panel) in different observation lengths. Grey filled bars represent the values for 1400 days of observation, and smaller observation lengths are shown in different colours. The red dashed lines represent the 1-σ range of the literature values. The legend states the percentage value of stars within 1-σ. In brackets we note the percentage value when taking the uncertainties of the fit into account. For νmax, using 27 d observations 19.88% of our sample falls outside of the 1-σ range in comparison to the full observation length. For Δν this decrease is much stronger, with 83.91% of the sample falling outside of 1-σ using 27 d of observation.
Current usage metrics show cumulative count of Article Views (full-text article views including HTML views, PDF and ePub downloads, according to the available data) and Abstracts Views on Vision4Press platform.
Data correspond to usage on the plateform after 2015. The current usage metrics is available 48-96 hours after online publication and is updated daily on week days.
Initial download of the metrics may take a while.