Fig. 4.
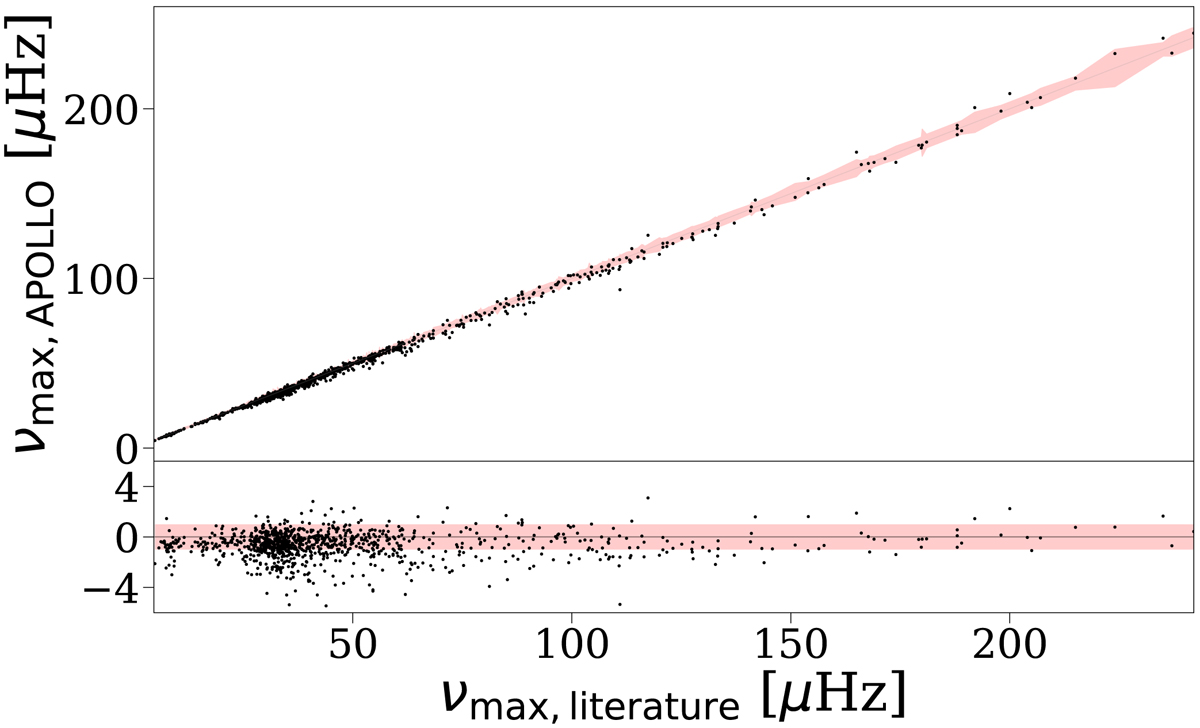
Resulting νmax, APOLLO values of the APOLLO pipeline in relation to catalogue values of our red-giant sample. Upper panel: comparison of νmax, APOLLO to the literature, with the red shaded area illustrating the 1-σ uncertainties in the literature. Lower plot: residuals in sigma of the literature value and again mark the uncertainties in the red shaded area.
Current usage metrics show cumulative count of Article Views (full-text article views including HTML views, PDF and ePub downloads, according to the available data) and Abstracts Views on Vision4Press platform.
Data correspond to usage on the plateform after 2015. The current usage metrics is available 48-96 hours after online publication and is updated daily on week days.
Initial download of the metrics may take a while.