Fig. 2.
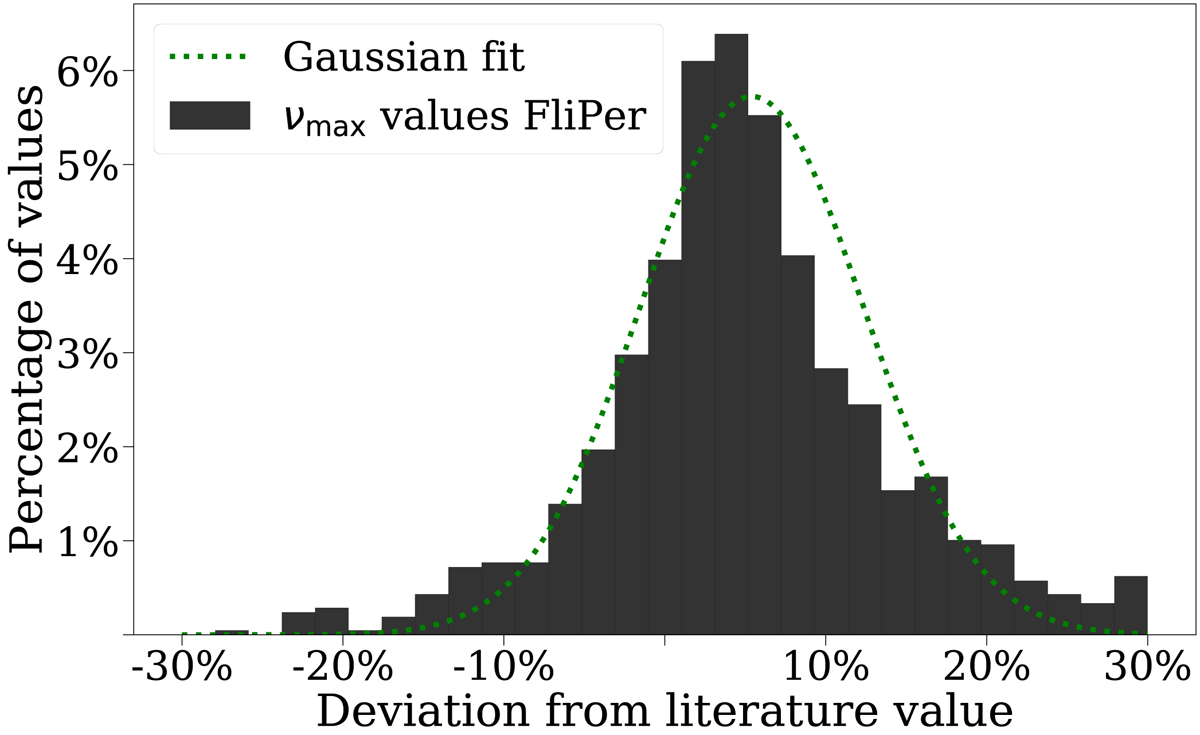
Distribution of values for νmax extracted from the FliPer method. The Y axis shows the percentage of values within a given bin of deviation from a corresponding literature value, while the X axis shows the deviation from the literature value in percent. The distribution can be represented by a Gaussian function, whose fit to the histogram is represented by a dotted green line. The mean for this distribution is at 4.95%, with a standard deviation of 6.93%. For visualisation purposes, deviations above 30% and below −30% are excluded.
Current usage metrics show cumulative count of Article Views (full-text article views including HTML views, PDF and ePub downloads, according to the available data) and Abstracts Views on Vision4Press platform.
Data correspond to usage on the plateform after 2015. The current usage metrics is available 48-96 hours after online publication and is updated daily on week days.
Initial download of the metrics may take a while.