Fig. 12.
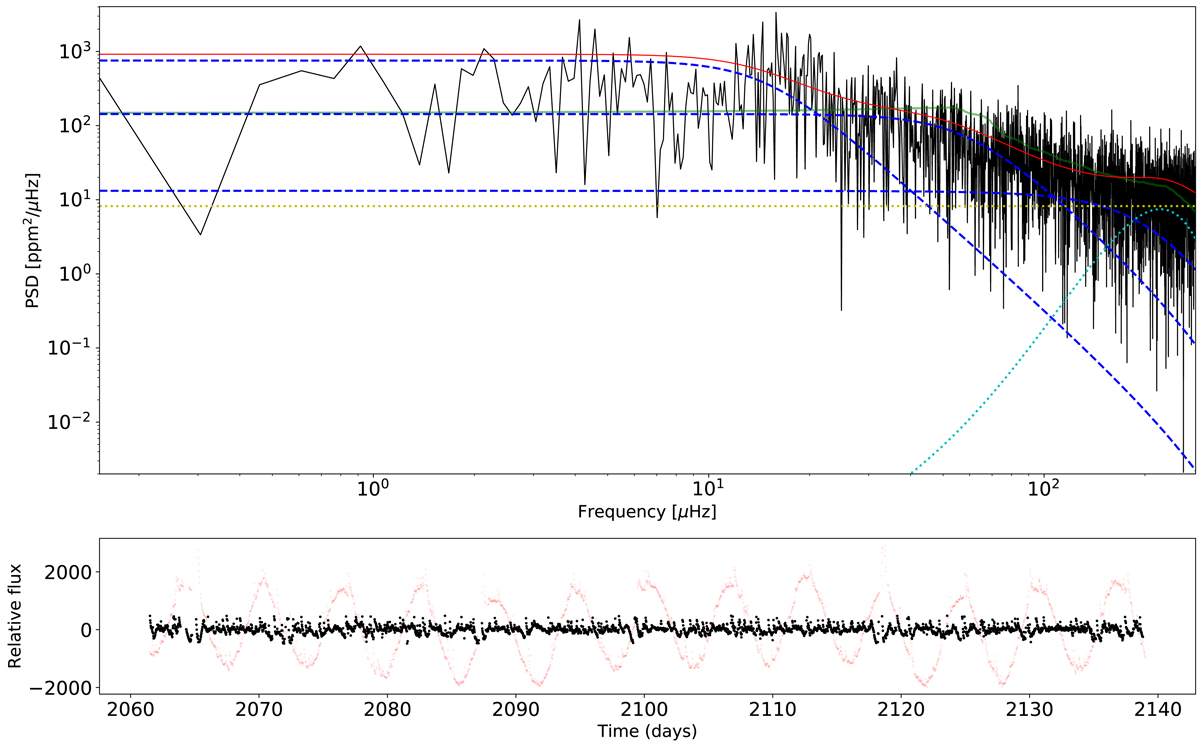
Upper panel: resulting fit for EPIC 205375290. In dashed blue are the Harvey-like functions, the dotted cyan line shows the power excess, the yellow dotted line the white noise, and the red solid line the full fit of the oscillation model. The green line represents a smoothed variant of the PSD. Lower panel: light curve of EPIC 205375290. The filtered and reduced light curve used for the analysis is shown in black while the original light curve is shown in red.
Current usage metrics show cumulative count of Article Views (full-text article views including HTML views, PDF and ePub downloads, according to the available data) and Abstracts Views on Vision4Press platform.
Data correspond to usage on the plateform after 2015. The current usage metrics is available 48-96 hours after online publication and is updated daily on week days.
Initial download of the metrics may take a while.