Fig. 11.
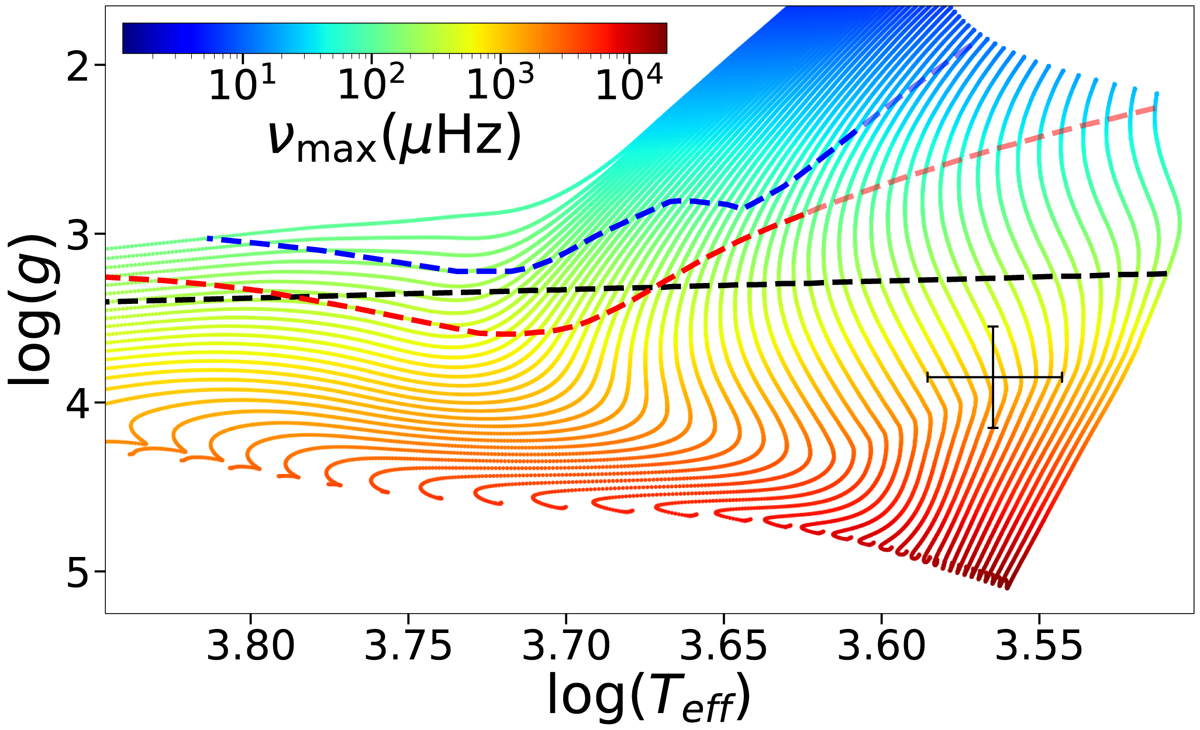
Evolutionary tracks in a log Teff − log g diagram. The colour code describes νmax obtained from the scaling relation. The black line shows the location at which νmax is equal to the Nyquist frequency of LC data. The red and blue lines show the locations of the birthline according to Palla & Stahler (1990) and Behrend & Maeder (2001), respectively. The black crossed object shows the spectroscopic observations for EPIC 205375290.
Current usage metrics show cumulative count of Article Views (full-text article views including HTML views, PDF and ePub downloads, according to the available data) and Abstracts Views on Vision4Press platform.
Data correspond to usage on the plateform after 2015. The current usage metrics is available 48-96 hours after online publication and is updated daily on week days.
Initial download of the metrics may take a while.