Free Access
Fig. 1.
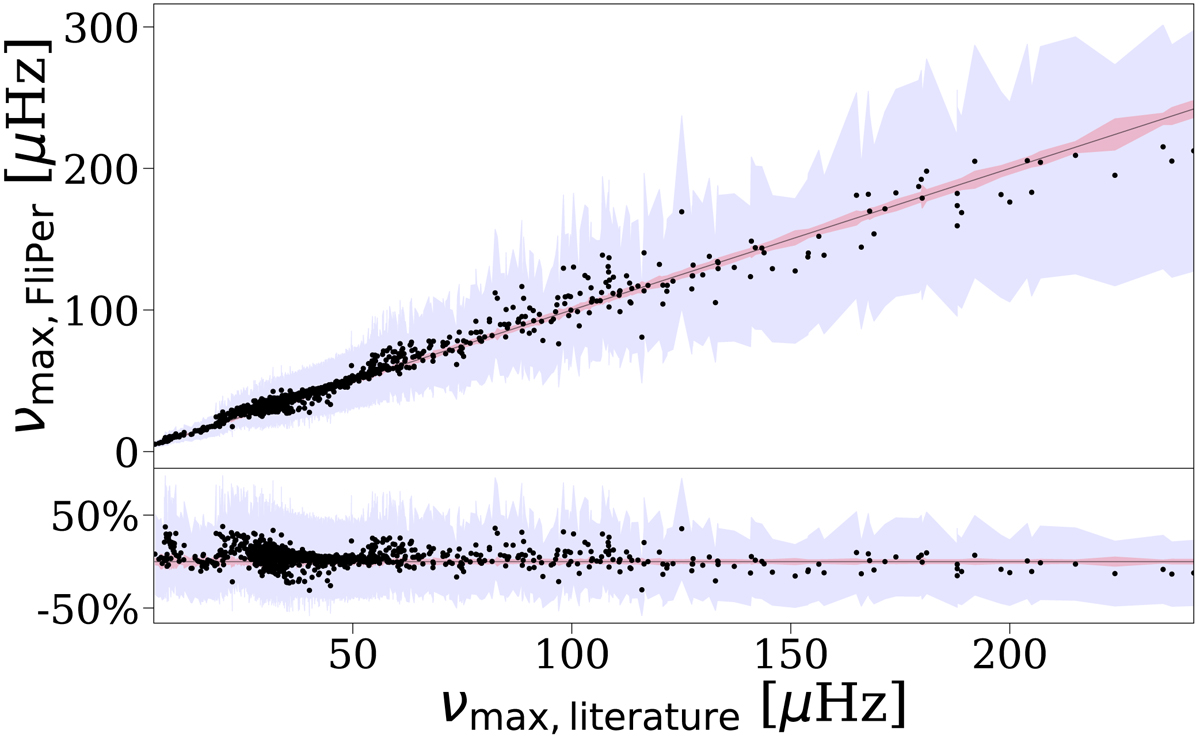
Upper panel: values for νmax extracted from the FliPer method as compared to the values from the APOKASC catalogue. Lower panel: corresponding residuals as percentile. The red shaded area represents the uncertainties in the catalogue. The blue shaded areas define our 1-σ interval, centred around νmax from FliPer.
Current usage metrics show cumulative count of Article Views (full-text article views including HTML views, PDF and ePub downloads, according to the available data) and Abstracts Views on Vision4Press platform.
Data correspond to usage on the plateform after 2015. The current usage metrics is available 48-96 hours after online publication and is updated daily on week days.
Initial download of the metrics may take a while.