| Issue |
A&A
Volume 647, March 2021
|
|
|---|---|---|
| Article Number | A103 | |
| Number of page(s) | 18 | |
| Section | Extragalactic astronomy | |
| DOI | https://doi.org/10.1051/0004-6361/202039562 | |
| Published online | 17 March 2021 | |
Galaxies with kinematically distinct cores in Illustris
1
Nicolaus Copernicus Astronomical Center, Polish Academy of Sciences, Bartycka 18, 00-716 Warsaw, Poland
e-mail: This email address is being protected from spambots. You need JavaScript enabled to view it.
2
Institute of Theoretical Physics, Faculty of Mathematics and Physics, Charles University, V Holešovičkách 2, 180 00 Prague, Czech Republic
3
FZU – Institute of Physics of the Czech Academy of Sciences, Na Slovance 1999/2, Prague 182 21, Czech Republic
Received:
30
September
2020
Accepted:
21
December
2020
Abstract
Context. The growing amount of integral-field spectroscopic data creates an increased demand for understanding kinematic peculiarities that carry valuable information about the evolution of host galaxies.
Aims. For kinematically distinct cores (KDCs), a number of formation mechanisms have been proposed, but it is still unclear as to which of them commonly occur in the Universe. We aim to address the KDC formation in the cosmological context.
Methods. We used the publicly available data of the large-scale hydrodynamic cosmological simulation Illustris. We identified 134 KDCs, studied their properties, and followed their evolution back in time. Examples of four galaxies hosting KDCs are presented and described in detail.
Results. The masses of the KDC hosts follow the general distribution of the Illustris galaxies, with a possible slight preference for massive galaxies. KDCs can be long-lived features, with their formation epochs distributed, roughly uniformly, between look-back times 0–11.4 Gyr, and they can survive even major or multiple subsequent mergers. There is no single channel of KDC formation, but mergers seem to be the formation mechanism for about 60% of KDCs with a significant preference for major mergers and with the percentage being higher among massive hosts. Other KDCs formed during a pericentric passage or flyby of another galaxy by the precession of a previously formed rapidly rotating core, or without an obvious external cause. The mean mass-weighted stellar age inside the KDC radius is either about the same as the look-back time of the KDC formation or older. Although the radii of our KDCs are, on average, larger than observed, we find that younger stellar ages are typically associated with smaller KDCs. A significant fraction of KDC hosts possess stellar shells that formed during mergers, which led to KDCs within the last 5 Gyr, or double peaks in their velocity dispersion maps.
Key words: galaxies: evolution / galaxies: interactions / galaxies: peculiar / galaxies: kinematics and dynamics / galaxies: structure
© ESO 2021
1. Introduction
Peculiarities in galaxies carry valuable information on the evolution of host galaxies. Different features can tell different pieces of the story about how their hosts were born and shaped over the course of time. In this paper, we focus on kinematically distinct cores (KDCs), that is to say central stellar components that show distinct properties of mean line-of-sight velocity from the main body of the host galaxy.
KDCs have been known for almost four decades, originally having been studied in one-dimensional (long-)slit spectroscopic data (Efstathiou et al. 1982; Bender 1988; Franx & Illingworth 1988; Jedrzejewski & Schechter 1988). With the increasing availability of two-dimensional observations – integral field spectroscopy (IFS), for example, Spectrographic Areal Unit for Research on Optical Nebulae (SAURON; de Zeeuw et al. 2002), ATLAS3D (Cappellari et al. 2011), Sydney-AAO Multiobject IFU (SAMI; Croom et al. 2012), Calar Alto Legacy Integral Field Area Survey (CALIFA; Sánchez et al. 2012), and Mapping Nearby Galaxies at APO (MaNGA; Bundy et al. 2015) – KDCs are being detected in larger quantities.
As is the case with many other objects and features in galactic astronomy, the term “KDC” is not well codified and the relevant features are subject to different terminology and classifications throughout the literature. They can be called “kinematically decoupled cores”, “kinematically peculiar cores”, or just “kinematically distinct (or decoupled) components”. They are divided and included into different categories. The IFS data are often analyzed with the help of the KINEMETRY routine (Krajnović et al. 2006), most notably the SAURON and ATLAS3D samples.
Four KDC hosts of the SAURON survey, reported in McDermid et al. (2006), were not labeled as KDCs in the subsequent papers (Emsellem et al. 2007; Krajnović et al. 2008), instead they form their own category of “central low-level velocity” (CLV) systems. Emsellem et al. (2007) and Krajnović et al. (2008) defined “kinematically decoupled component” as a stellar velocity component having either an abrupt change in the kinematic axis with a difference larger than 20°, or an outer low-level velocity component (i.e., maximum velocity amplitude lower than 15 km s−1).
Krajnović et al. (2011), analyzing the ATLAS3D sample, classified the “kinematically distinct core” as having an abrupt change in the kinematic axis by at least 30°; however, if the change is close to 180°, the feature is placed into a separate category of “counter-rotating cores” (CRC). Moreover, in the category “double σ” (2σ) – two symmetric velocity dispersion peaks along the major axis (see also Sect. 3) – most of the galaxies also have KDCs.
Graham et al. (2018) inspected the MaNGA sample. They recognized two categories: “kinematically decoupled cores”, that is to say rotating cores that are small compared to the galaxy, which itself is nonrotating, and “2σ counter-rotators” that show either two strong velocity dispersion peaks along the major axis or clear counter-rotation and high velocity dispersion at the counter-rotation boundary.
Somewhat in contrast to MaNGA, Schulze et al. (2018), classifying galaxies in the Magneticum Pathfinder simulation, define “distinct cores” as central rotating components surrounded by a low-level or nonrotating component and “kinematically distinct cores” (including counter-rotating cores) as central rotating components surrounded by a region with inclined rotation with respect to the central component. Throughout this paper, we include all of the abovementioned groups under the abbreviation KDC, except for the 2σ category, where we consider only galaxies with the KDC that are visible in the mean line-of-sight velocity data.
KDCs are typically found in early-type galaxies (ETGs, i.e., ellipticals and lenticulars). Based on their specific stellar angular momentum, ETGs are divided into two classes – fast and slow rotators (Emsellem et al. 2007, 2011; Krajnović et al. 2008, see also Cappellari 2016 for a review). Fast rotators (FRs) are more numerous (86% of the ATLAS3D sample; Emsellem et al. 2011) and have regular velocity fields which qualitatively resemble those of disks. Slow rotators (SRs) are more pressure supported and tend to be more massive and round. SRs are also more likely to host a KDC. KDCs are found in 29% of the galaxies (17% of FRs and 67% of SRs) in the SAURON survey of 48 nearby ETGs (Emsellem et al. 2007; Krajnović et al. 2008). Counting all KDCs listed in McDermid et al. (2006), Emsellem et al. (2007), and Krajnović et al. (2011), the KDC hosts constitute only around 13% of galaxies (around 5% of FRs and over 60% of SRs) in the ATLAS3D project, which is comprised of a complete volume- and magnitude-limited sample of 260 ETGs. Ricci et al. (2016) found one KDC in their IFS data of ten massive nearby ETGs (10%) and Koprolin & Zeilinger (2000) reported a 32% KDC rate in the long-slit spectra of 53 ETGs.
The incidence of KDCs does not show an obvious dependence on the density of the environment. Long-slit spectra of 13 isolated early-type galaxies reveal four (31%) KDCs (Hau & Forbes 2006). In the Fornax3D project – an IFS survey of the 31 brightest galaxies inside the virial radius of the Fornax cluster – Iodice et al. (2019) found that 33% of their 21 ETGs (32% of FRs and 50% of SRs) host KDCs. In addition to this, they found one KDC among their ten late-type galaxies (LTGs, i.e., spirals and irregulars) and thus the overall abundance of KDCs in their sample is 26%. Loubser (2009) reported that 15 out of 49 of the brightest cluster galaxies (31%) host KDCs. The MUSE Most Massive Galaxies (M3G; Krajnović et al. 2018) IFS survey uncovers 20% of KDCs among 25 massive ETGs located in the densest galaxy environments.
However, outside the densest galaxy environments, KDCs seem to be underrepresented among the very massive ETGs. Only 2% of galaxies host KDCs in the MASSIVE survey – a volume-limited IFS study of the 90 most massive ETGs (Ene et al. 2018). This is in contradiction with the previous findings that KDCs are more frequent among SRs, and SRs are mostly massive galaxies. Indeed, SRs (including galaxies classified as nonrotators) constitute 76% of the MASSIVE survey, yet only two KDCs have been reported in the whole sample.
KDCs are also found at a lower rate in early-type dwarf galaxies (dEs) without an evident dependence on the density of the environment. Janz et al. (2017) found one out of nine isolated dEs to host a KDC, which is comparable to two KDCs reported by Toloba et al. (2014) in the sample of 39 dEs in the Virgo cluster. In groups or lower density environments, KDCs are detected in two out of 14 dEs (see Toloba et al. 2014, and references therein). KDCs were found in several spirals, that is to say late-type disk galaxies, in the form of a structure which counter-rotates with respect to the main stellar body and often has a disk-like morphology (e.g., Merrifield & Kuijken 1994; Vergani et al. 2007; Coccato et al. 2011; Iodice et al. 2019). In spirals, KDCs occur significantly less frequently compared to lenticulars, that is to say early-type disk galaxies, where they were detected in less than 10% of cases (Kuijken et al. 1996; Pizzella et al. 2004; Kannappan & Fabricant 2001).
The KDCs of disk galaxies are typically characterized by younger stellar populations accompanied by a substantial amount of gas (Johnston et al. 2013; Pizzella et al. 2014; Mitzkus et al. 2017), while SRs predominantly host KDCs which show no stellar population signatures over or above the well-known metallicity gradients in early-type galaxies and they are largely consistent with old (10 Gyr or older) stellar populations (Kuntschner et al. 2010). McDermid et al. (2006) recognized two populations of KDCs in the IFS data of 14 ETGs hosting KDCs: (1) kpc-scale KDCs with diameters around 1 kpc or larger and stellar populations older than 8 Gyr, residing in SRs; and (2) compact KDCs with diameters of less than a few hundred parsecs, showing a whole range of stellar ages, found exclusively in FRs, with kinematics close to counter-rotation around the same axis as their host.
Attempts to explain the origin of the KDCs are almost as old as their first observations. Kormendy (1984) already proposed that more robust cores of dEs can survive a merger with a bigger elliptical galaxy and form a KDC in its center. Balcells & Quinn (1990) verified this scenario using self-consistent dissipationless (i.e., gas free) numerical simulations where the KDC is formed in retrograde mergers between elliptical galaxies of unequal mass (mass ratios 1:5 and 1:10).
After that, the focus shifted toward disk progenitors and more major mergers. KDCs were reproduced in dissipationless simulations of mergers of two disk progenitors – Balcells & González (1998) reached the best results with the mass ratio 1:2, while Bendo & Barnes (2000) favored 1:1 mergers – but major mergers with nonzero gas content seem to be more successful. Jesseit et al. (2007) explored 1:1 and 1:3 disk mergers with a 0 and 0.1 gas fraction and found that KDCs almost exclusively formed in equal-mass mergers with a dissipational component. Hoffman et al. (2010) investigated 1:1 disk mergers with gas fractions of 0–0.4 and only found KDCs in remnants with at least a 0.15 initial gas fraction and most of them were in the range of 0.15–0.2. Bois et al. (2011) simulated disk mergers with a 0.1 gas fraction and remergers of the ETG merger products, and they conclude that the major mergers of disks (1:1 and 2:1) on retrograde orbits are most likely to produce KDCs. All of their KDCs were destroyed when going through the subsequent remerger. Schulze et al. (2017) studied a KDC that was produced in a retrograde 1:1 spiral galaxy merger simulation with a 0.2 gas fraction. The rotation axis of the KDC was engaged in a precession motion and the KDC dissolved after about 3 Gyr.
Generally, a retrograde configuration of the merger seems favorable to the KDC formation (Balcells & Quinn 1990; Bois et al. 2011; Schulze et al. 2017), but Tsatsi et al. (2015) show that KDCs can also originate from an initially prograde dissipational 1:1 merger, where the orbital spin is reversed by reactive forces due to substantial mass loss. Rantala et al. (2019) simultaneously simulated the origin of KDCs and cored density profiles of the centers of ETGs. These observed cored profiles are difficult to obtain in models where the KDC formation relies on gas dissipation in galaxy centers resulting in star formation. Rantala et al. (2019) performed a series of minor and major mergers with supermassive black holes (SMBHs) and the cored profile is a result of the scouring of stars in the centers by merging SMBHs. KDCs naturally arise from the same process in the major-merger simulations. As opposed to the popular single major-merger origin, in a series of 95 hydrodynamical simulations of minor and major binary mergers, binary merger trees with multiple progenitors, and multiple sequential mergers of Moody et al. (2014), KDCs are found infrequently in binary mergers, but multiple merger remnants commonly host KDCs.
KDCs were also studied in the cosmological context. Khochfar et al. (2011) took advantage of semi-analytic modeling and conclude that KDCs formed in SRs during gas-rich major mergers at high redshift, followed by minor mergers, which build up the outer layers of the remnants, while FRs are less likely to form KDCs since they underwent, on average, less than one major merger in their past. In the set of cosmological hydrodynamical simulations Magneticum Pathfinder, Schulze et al. (2018) detected KDCs in 40 out of 900 galaxies (5%), in similar rates among fast and slow rotators (4% of FRs and 6% of SRs).
In another hydrodynamical cosmological simulation, Taylor et al. (2018) found two out of 82 well-resolved galaxies having KDCs (2%). None of the KDCs and three other kinematically atypical galaxies in their simulation formed due to major mergers. Originally field galaxies entered cosmological filaments where an accretion of gas with different angular momentum triggered AGN feedback. The KDCs are formed in subsequent minor mergers on retrograde orbits, compared to the spin of the stellar component of the primary. A similar mechanism of KDC formation – consequential gas accretion from two distinct large-scale cosmological filaments in a specific spatial configuration – was reported in a zoom-in cosmological simulation by Algorry et al. (2014).
Other merger-free scenarios of KDC origins include an early collapse without subsequent mergers (Harsoula & Voglis 1998), flybys of other galaxies (Hau & Thomson 1994; González-García et al. 2005), or a separatrix crossing mechanism. This mechanism can, in the case of a change in the symmetry of the gravitational potential, cause stars on box orbits to separate into clockwise and counterclockwise streaming tube orbits (Evans & Collett 1994).
KDCs seen in the velocity maps can represent intrinsically more centrally concentrated embedded small components or just a part of more extended kinematic structures. Two kinematically different, but spatially overlapping components, can leave their imprint in the form of enhanced velocity dispersion such as the 2σ structure or σ-drop (see also Fig. 15). However, they can manifest themselves as a KDC in the mean line-of-sight velocity field only if one component is dominating the field in the center and the other in outer parts.
Moreover, some KDCs cannot be truly distinct or decoupled structures. The (weak) triaxial nature of the slow rotators (Cappellari et al. 2007) allows them to support multiple types of different orbit families and, in some projections, these can appear as if the host possessed a KDC (Statler 1991). van den Bosch et al. (2008) demonstrated this effect with triaxial Schwarzschild modeling (Schwarzschild 1979) on a known KDC host, NGC 4365. They found no major transition in the orbital structure at the boundary of the KDC, meaning that the observed KDC is not physically distinct from the main body, but rather caused by a projected superposition of the orbits. Nedelchev et al. (2019) supported that idea with a kinematic decomposition technique applied on the IFS observation of the galaxy.
Another effect that can cause a KDC to appear in the velocity maps is described in Díaz & Dottori (2013, 2016). Warps that commonly occur in the disks of galaxies, when observed face-on, can make an impression of a counter-rotating core in the projected velocity maps, even though the rotation axes of inner and outer parts of the disk are only slightly misaligned.
In this work, we investigate the origin and properties of KDCs simulated in the cosmological context within the Illustris project (Vogelsberger et al. 2014a; Nelson et al. 2015) – a state-of-the-art large-scale (106.53 Mpc3 periodic box) cosmological simulation that follows the evolution of dark matter and different baryonic components from redshift z = 127 up to the present time, using the AREPO moving-mesh code (Springel 2010). We only used the Illustris-1 run, which has 6 × 10⁹ initial hydrodynamic cells with the mean mass of a baryonic particle 1.6 × 10⁶ M⊙ at the end of the simulation and 6 × 10⁹ dark matter particles with a particle mass 6.3 × 10⁶ M⊙. The particle data for 134 snapshots between redshifts 14 and 0 are publicly available, as well as subhalo catalogs and merger trees (Rodriguez-Gomez et al. 2015).
The paper is organized as follows. In Sect. 2.1, we describe the sample and our selection procedure; in Sects. 2.2 and 2.3, we investigate the birth time of the KDCs and the merger history of their hosts; in Sects. 2.4 and 2.5, relations of measured quantities are examined; in Sect. 2.6, four examples of the Illustris KDCs are shown in detail; and the results are discussed and summarized in Sects. 3 and 4, respectively.
2. Results
2.1. Sample selection and characteristics
Our sample of galaxies with kinematically distinct cores in Illustris was selected by visual inspection of maps of the mean line-of-sight velocity of Illustris subhalos. We started with all 7697 subhalos with more than 104 stellar particles in the final output (redshift z = 0) of the Illustris-1 run, identified in the SubFind Subhalo catalog (Vogelsberger et al. 2014b; Nelson et al. 2015). We refer to those subhalos simply as galaxies and to the set of 7697 galaxies as the global sample.
For each galaxy, we constructed mean line-of-sight velocity maps of the stellar component in three projections with two different fields of view: 30 × 30 kpc and 1.5 × 1.5 rmax, where rmax is the same radius as defined in Ebrová & Łokas (2017) as the radius at which the average 3D stellar density in a shell between 0.8rmax and 1.25rmax is equal to 1.4 × 10⁴ M⊙ kpc−3. The typical surface brightness at the projected radius rmax of spherical galaxies is 29.5 (29.0) mag arcsec−2 for the mass-to-light ratio of 5 (3). The projection planes of the maps correspond to the principal planes of the respective galaxy inferred using the inertia tensor for stellar matter inside rmax.
For each field of view, we constructed maps with fixed bin sizes as well as maps with Voronoi tessellation. The latter uses the Voronoi relaxation algorithm (Du et al. 1999; Lloyd 1982) to divide the map into bins with similar stellar masses. First, we binned the map into a 750 × 750 mesh and applied Gaussian smoothing with the radius equal to 0.27 kpc, then we ran the Voronoi relaxation algorithm. We overlayed the tessellated map with a white mask corresponding to those areas of the original 750 × 750 mesh where the surface density is below 96 M⊙ kpc−2 (the value was chosen, in part arbitrarily, in order for the borders of the white area to be similar to the outer isophots in surface-brightness maps). These kinds of maps can be seen in Figs. 1, 13, 15, and 16 for the kinematics of the galaxies. All of our kinematic maps were mass-weighted.
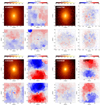 |
Fig. 1. Examples of four Illustris galaxies with KDCs from our sample (properties of the galaxies are listed in Table 1). Each 2 × 2 segment of panels belongs to one galaxy with the maps of surface density and mean line-of-sight velocity viewed along the intermediate axis of the galaxy displayed in the top left and right panels, respectively. Lower left and right panels: mean line-of-sight velocity viewed along the minor and major axis, respectively. The fields of view corresponds to 1.5 × 1.5 rmax. |
We performed a visual inspection of the maps and selected 134 Illustris galaxies with a KDC visible in at least one projection plane. All selected galaxies were reviewed by two members of our team. The galaxies in the Illustris-1 run have a limited resolution – the gravitational softening length is 0.7 kpc (1.4 kpc) for the baryonic (dark-matter) component, thus sub-kiloparsec kinematic features are not reliably resolved. For this reason our sample does not contain small, compact KDCs such as those reported in fast rotators by McDermid et al. (2006). In order to have a sufficiently large sample, we included proper kinematically distinct cores as well as more extended central components that often exceed the effective radius of the host galaxy (for more details on the host effective radii, see Sect. 2.4 and Fig. 7). However, for a galaxy to be included in our sample, we required that the KDC cover, at most, roughly about half of the wider, 1.5 × 1.5 rmax, fields of view of the velocity maps. The most extended KDC in our sample turns out to have the radius rKDC = 0.4rmax, while half of the sample has rKDC < 0.2rmax. We did not include rapidly rotating cores that have similar orientations of the kinematic axes as the outer parts of their host galaxies. Figure 1 shows four examples of galaxies from our Illustris KDC sample. The galaxies were chosen to show examples of different KDC evolutions (see Sect. 2.6; properties of these four galaxies are listed in Table 1). Throughout the paper (except Fig. 12) x, y, and z denote the major, intermediate, and minor axis of a galaxy, respectively. We refer to galaxies by their SubFind ID from the last snapshot throughout their entire evolution, even though their progenitors in previous snapshots have different SubFind IDs.
Properties of four selected Ilustris galaxies with KDCs.
We measured the KDC radii, rKDC, by combining information about the stellar component from the velocity maps and two radial profiles: (1) the radial profile of the mean tangential velocity, v⊥,mean, in spherical bins in 3D and in circular bins for the projected data; and (2) the radial profile of the angular difference between the directions of the angular momenta inside and outside the given radius, α(Lin, Lout), for 3D and projected data, where α is defined as follows
 (1)
(1)
Figure 2 shows the radial profiles for the four galaxies from Fig. 1. The KDC radius inferred from the velocity maps nicely corresponds to the minimum or to the end of the decline of v⊥,mean. It is also usually near the maximum value and/or near the position of maximum gradient of α(Lin, Lout), but the correlation is not so tight and the radial shape of α(Lin, Lout) depends on many factors, such as the relative orientation of the kinematic components, the relative magnitude of their velocities, and the size and shape of the KDC. We made attempts to use α(Lin, Lout) to automatically identify KDCs in Illustris galaxies, but we did not have much success. Some KDC hosts have relatively small maximal values of α(Lin, Lout) and similar values are often produced in other galaxies due to other features (e.g., streams and tails in outer parts or kinematic twists) or due to inherent fluctuations. Therefore, we resorted to the visual inspection of the velocity maps. The precision of the measurements of rKDC is around 1 kpc, and 0.5 kpc for the smallest KDC.
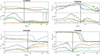 |
Fig. 2. Radial profiles of the mean tangential velocity, v⊥,mean, and the difference between the directions of the angular momenta inside and outside the given radius, α(Lin, Lout), for the stellar component of the four galaxies from Fig. 1. The quantities were measured in 3D and in the projection on three principal planes of the respective galaxy. Angles are expressed in radians. The black vertical lines denote the inferred KDC radius, rKDC. |
Figure 3 compares the distribution of stellar mass inside rmax at redshift z = 0 for the KDC hosting galaxies with the global sample of 7697 galaxies. The global sample was normalized to the KDC host sample. The distribution of the KDC hosts was truncated for low-mass galaxies probably because the resolution of these galaxies in the simulation was not sufficient for us to detect KDCs. Thus, our KDC sample is incomplete for low-mass galaxies. The gray histogram in Fig. 3 shows the mass distribution for the 1160 galaxies with masses higher than 7.4 × 10¹⁰ M⊙ normalized to the 90 KDC hosts in the same mass range. The threshold 7.4 × 10¹⁰ M⊙ is the lower boundary of the first bin where the detection of the KDCs is reliable since the galaxies are well resolved and there is no longer a significant increase in detected KDCs with the mass of the galaxy. For the well-resolved galaxies, we see that KDC hosts tend to follow the global mass distribution with a slight preference for massive galaxies. This is interesting in comparison with Illustris galaxies with prolate rotation, which are clearly biased toward more massive galaxies, see Fig. 4 in Ebrová & Łokas (2017).
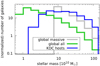 |
Fig. 3. Comparison of the stellar mass distribution of the KDC hosts with the global sample. The distribution of the global sample was normalized to the same total number as for the KDC hosts. The gray histogram shows the mass distribution of the global sample for galaxies more massive than 7.4 × 10¹⁰ M⊙, which were normalized to the same number as the KDC hosts in the mass range. |
2.2. Times of birth of KDCs
To determine the times in which the KDCs emerged, we used Illustris data from snapshots 60–135 corresponding to the last 11.6 Gyr of evolution (redshifts 3.0 > z > 0). The look-back times were computed with the cosmological parameters consistent with the Wilkinson Microwave Anisotropy Probe-9 measurements (Hinshaw et al. 2013) as these parameters were also adopted in the Illustris simulation. The average value of the time spacing between snapshots is 156 Myr during the last 10 Gyr of the simulation.
We followed the main progenitor branch of the Illustris SubLink merger trees (Rodriguez-Gomez et al. 2015) for all of our 134 KDC hosts. We plotted the maps of stellar velocity as well as the radial profiles of v⊥,mean and α(Lin, Lout) (see Fig. 2) for all 76 snapshots for each galaxy. The maps were plotted in the three projection planes that correspond to the principal planes in the last snapshot. We kept the orientation the same for the planes in all snapshots even though they are not the principal planes of the galaxy in the earlier snapshots.
We inspected the maps and the radial profiles for the same snapshots simultaneously. We marked the earliest snapshot at which we can see the KDC. Merger events make the plots chaotic, thus if we were not able to see the KDC for a few snapshots, we still counted this as a continuous existence of the KDC. We allowed for the KDC to not be visible in approximately three snapshots – the number is not exact since, in such cases, one or more snapshots usually have a borderline visibility of the KDC. In case the KDC is not evident for a larger number of snapshots, we marked the subsequent emergence of the KDC as the KDC birth.
The black histogram in Fig. 4 shows the distribution of look-back times of the KDC births. The distribution is almost uniform with a slight deficiency in birth times larger than 9 Gyr. This is in contrast to the prolate rotation in Illustris, where almost all cases were younger than 6 Gyr (Ebrová & Łokas 2017).
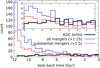 |
Fig. 4. Histograms of time distribution of KDC births and mergers undergone by their host galaxies. The inset shows a zoom on the last 8 Gyr. |
2.3. Mergers
We analyzed the merger history of our KDC hosts using the SubLink trees. We followed the branches of the next progenitors (secondaries) that (1) occurred in the merger tree of the primary galaxy during the last 12.6 Gyr (since snapshot number 49, redshift z = 5.0)1; and that (2) had at least 5% baryonic mass of the primary in at least four snapshots during the last 20 snapshots of their existence. There are 1677 such secondaries for our sample of 134 KDC hosts. For these secondaries, we computed the merger mass ratio as the ratio of stellar matter of the merger progenitors in the snapshot in which the secondary progenitor reaches its maximum stellar mass, as suggested in Rodriguez-Gomez et al. (2015), but only in the last 20 snapshots of their existence. For secondaries that had more stellar mass than the primary in the snapshot of the mass measurements, the merger mass ratio was set to 1:1. We marked the time of the merger at the look-back time of the last snapshot in which the secondary progenitor still has at least ten stellar particles.
During all these calculations, we prohibited the secondary galaxy from gaining stellar particles from the primary. That means that we checked all IDs of the stellar particles in the secondary and if particles belonged to the primary in previous snapshots, these particles were treated as a part of the primary. This action was motivated by the structure of the Illustris catalog. The SubFind algorithm ran independently on each snapshot data. In the case of a merger of two similarly massive galaxies, the majority of particles is often assigned to the primary and secondary progenitors alternately in subsequent snapshots. This would make the measurements of the merger mass ratio incorrect.
From now on, we consider only the mergers with the stellar-mass ratio of at least 1:15 and the time of the merger younger than 12.2 Gyr (snapshot number 54, redshift z = 4.0). One KDC host had no such merger. The remaining 133 KDC hosts collectively underwent exactly 800 mergers, between one and 14 mergers for an individual host. More than half of these mergers took place more than 10 Gyr ago, as shown in the blue histogram in Fig. 4, while only ten KDCs are that old. The red histogram in Fig. 4 shows the distribution of 418 mergers with a stellar-mass ratio of at least 1:5 – we refer to them as “substantial mergers”.
From the 800 mergers, we selected the “closest mergers” to the KDC birth (Sect. 2.2) for the 133 hosts that experienced a merger. We picked the merger with the smallest snapshot difference. In case there were more mergers with the same difference, we took the one with the highest merger mass ratio. The distribution of the snapshot difference is shown as the blue histogram in Fig. 5. It shows a strong peak around zero. To prove that the peak is significant, we repeated the selection of the closest mergers, but with the snapshot numbers of the KDC birth permuted within the sample of 134 KDC hosts – the orange histogram in Fig. 5.
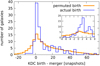 |
Fig. 5. Distribution of the snapshot difference between the KDC birth and the closest merger undergone by the host galaxy for the actual KDC births (in blue) compared to the distribution where the KDC births were permuted within the sample (in orange), with the bin size of three snapshots. The inset is a zoom around zero for the actual births, with the bin size of one snapshot. One snapshot is approximately 0.16 Gyr. |
The permuted sample was averaged over all possible permutations. We did it by pairing each KDC birth with all of the other 133 merger histories within the sample and we took each pair with the weight of 1/133. This way, we compared the merger snapshots with a randomized KDC birth for each galaxy, but we were able to keep the same distribution of KDC births. The histogram for the permuted births indeed shows a much less pronounced peak of the closest mergers. Both distributions, for permuted and actual births, have a long tail in positive values just because a galaxy is more likely to experience mergers at early times, see Fig. 4.
The inset in Fig. 5 shows the snapshot difference around zero with the bin size of one snapshot. In this histogram, we see that the highest peak of the actual births is, in fact, at the snapshot difference equal to two. That means that the KDC is most likely to emerge two snapshots (approximately 0.3 Gyr) after the merger. Following this finding, we consider a merger to be associated with the KDC birth if the merger occurs ±6 snapshots (within ±1 Gyr) from the peak of the distribution, that is the KDC birth occurred from four snapshots before to eight snapshots after the merger. There are 81 KDC hosts with 125 mergers in this asymmetric 13-snapshot window around the KDC birth, out of which 61 had only one merger, 12 had two, four had three, and the remaining four had 4, 5, 7, and 12 mergers, respectively. For the cases with multiple mergers, we selected one “associated merger” with the highest merger mass ratio.
In Fig. 6, we compare the distribution of the merger stellar-mass ratios of the associated mergers for the actual and permuted KDC births. The insets show the same comparison, but for more “tightly associated mergers”, where the KDC birth occurred between the merger snapshot to four snapshots after the merger – mergers within an asymmetric five-snapshot window around the KDC birth. The histograms show that the association between the actual births and mergers is significantly higher than for the “randomized” permuted sample, mainly for the substantial mergers. From all 134 KDCs and all 800 mergers during the whole investigated period of the last 12.2 Gyr of the simulation, 81 (52) KDCs with actual births and 45.1 (23.8) KDCs with permuted births had (tightly) associated mergers and are displayed in the upper panel of Fig. 6.
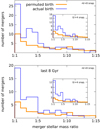 |
Fig. 6. Distributions of the stellar-mass ratios for associated mergers for the actual KDC births (in blue) and permuted KDC births (in orange). Upper panel: whole investigated period of 12.2 Gyr, lower panel: associated mergers for the last 8 Gyr of the simulation. The insets show the same distributions for tightly associated mergers. |
Since there is an abundance of mergers at higher look-back times, the probability of the merger being associated by coincidence is higher. Therefore, we checked the associated mergers for a subset of 103 KDCs that emerged during the last 8 Gyr of the simulation, where the mergers are sparser. Overall, the 103 hosts with the actual KDC births underwent 148 mergers and the 103 hosts with the permuted birth underwent 134 mergers during this period, out of which 57 (37) KDCs with the actual births and 27.6 (12.3) KDCs with the permuted births had (tightly) associated mergers. The distribution of their mass ratios is shown in the lower panel of Fig. 6.
As expected, the percentage of KDC hosts with associated mergers decreased slightly in the period with less frequent mergers – 60% for the whole period and 55% for the last 8 Gyrs. However, the mergers during the shorter and more recent period are more likely to be associated with the KDC birth – 16% of the mergers fall into the 13-snapshot window around the KDC birth during the whole period, while for the last 8 Gyr it is 46%. Overall, the KDC birth is more likely to be associated with major mergers and, in the same period, major mergers seem to be more tightly associated with the KDC birth. From the 81 associated mergers, 56 are substantial (the stellar-mass ratio is at least 1:5) and only seven have a stellar-mass ratio between 1:10 and 1:15.
2.4. KDC stellar ages and sizes
For each galaxy in our sample, we adopted an effective radius, reff, as an average of effective radii from de Vaucouleurs’ fits in the three principal projection planes. The fits were performed on the average surface density of stellar particles in circular bins between 1 kpc and rmax. The average reff corresponds very well to the effective radius in xz-plane. Figure 7 shows the correlation of reff and the half mass radius for stellar particles given by the Illustris subhalo catalog for our sample at z = 0. Especially for massive galaxies, the Illustris radius is larger probably due to the richness of the tidal structures in the outer parts of these galaxies and because the outer parts of nearby smaller galaxies are usually assigned to the massive galaxy by the SubFind algorithm. We believe our approach to be a good approximation for the effective radius that would be inferred observationally.
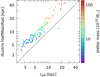 |
Fig. 7. Correlation of the average of effective radii from de Vaucouleurs’ fits (reff) in the three principal projection planes of the respective galaxies with the half mass radius for stellar particles given by the Illustris subhalo catalog (HalfMassRad) for our KDC host sample at z = 0. The stellar mass of the host galaxies are color coded. |
Figure 8 shows KDC sizes, KDC stellar ages, and host masses, which were all measured in the last snapshot of the simulation at z = 0. The KDC stellar age was measured as the mean mass-weighted age of stellar particles inside the KDC radius rKDC. The first panel shows the actual physical sizes of the KDCs versus their stellar ages. The vertical alignment of the points is due to the limited resolution of rKDC. Even though our KDC sample covers a different range of KDC sizes, the graph partially recovers the trend reported for the SAURON sample (McDermid et al. 2006, and their Fig. 16; see also Sect. 1) – KDCs with older stellar ages cover a wide range of sizes, while younger stars are associated with smaller values of rKDC. In our case, this trend is mostly driven by the link between the KDC size and the size (or mass) of the host galaxy. In the middle panel of Fig. 8, the KDC radius is replaced with the KDC relative size rKDC/reff – the ratio of the KDC radius and the host galaxy effective radius – and the above-described trends mostly disappear.
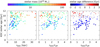 |
Fig. 8. KDC sizes versus the mass-weighted stellar ages inside rKDC. The first panel shows the actual physical sizes of the KDCs, and the other two panels show their relative size rKDC/reff. The stellar mass of the host galaxies at redshift z = 0 for the first two panels and the age difference between stars inside and outside rKDC (inner minus outer) for the last panel are color coded. |
The host stellar mass in the first two panels is color coded. In the last panel of Fig. 8, the color reflects the difference between the mean mass-weighted age of stars inside and outside rKDC. The outer region includes stellar particles between the 1.1rKDC and the radius rmax as defined in Sect. 2.1. In the case that 0.1rKDC is smaller than 0.7 kpc (the gravitational softening length), the inner radius was set to rKDC + 0.7 kpc. The age difference was mostly determined by the KDC stellar age and ranges from -2.7 Gyr for the young KDC stars to 3.0 Gyr for the old ones. Most galaxies with close-to-equal inner and outer stellar ages occur around the age 10 Gyr.
2.5. Birth-merger-age correlations
Figure 9 shows the correlations between the KDC birth, mergers, and the KDC stellar age. For the 81 KDCs that have an associated merger, we display the associated merger; for the remaining KDCs, 52 are paired with the closest merger and the one KDC host that did not experience any merger in the probed period is paired with its last merger 12.39 Gyr ago, even though the merger occurred just outside the probed period (see Sect. 2.3). The KDC relative size rKDC/reff is color coded – the ratio of the KDC radius and the host galaxy effective radius (see Sect. 2.4). The size of the circles is proportional to the stellar mass of the galaxies at the end of the simulation. It is important to note that the inclination of massive galaxies toward old stellar ages holds generally for all the galaxies, with or without the KDC.
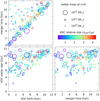 |
Fig. 9. Correlations between the time of the KDC birth and the associated or closest merger and the mass-weighted stellar age inside rKDC. The time labels are expressed in terms of the look-back time. Circle areas are proportional to the stellar mass of the galaxies at redshift z = 0. Colors reflect the relative sizes of the KDCs at z = 0. |
The tightest correlation is between the KDC births and mergers (the top panel of Fig. 9). The correlation is especially strong for the massive galaxies – 63 out of 75 (84%) hosts with a stellar mass larger than 1011 M⊙ have an associated merger, while for the 59 less massive hosts it is only 18 (30%). Even though some galaxies experienced more mergers after the KDC birth, almost all the hosts without the associated mergers underwent the closest merger prior to the KDC birth.
All the KDC stellar ages are close to the KDC birth or older (the bottom left panel of Fig. 9), meaning that inside the KDC radius, there are not many stars that are significantly younger than the KDC birth. However, the KDC stellar ages can be significantly larger than the time of the KDC birth. The correlation between the KDC stellar ages and birth seems to be independent of the associated mergers. For both groups, that is to say KDCs with and without associated mergers, a quarter of the KDC stellar ages are within 1 Gyr from the birth (21 out of 81 with the associated merger and 13 out of 53 without one).
The KDC stellar ages and mergers show no apparent correlation (the right panel of Fig. 9). This is a result of the abovementioned findings: (1) some closest mergers are not associated with the KDC birth, (2) there are a lot of KDCs with stellar ages older than the KDC birth, and (3) the age-birth correlation is partially independent of the birth-merger.
There seems to be no clear correlation between the KDC relative size (the circle colors in Fig. 9) and the other quantities. The less compact KDCs tend to occur in less massive hosts, but this could be an effect of the selection procedure and the limited resolution of the low-mass galaxies. Nonetheless, it is worth noting that while compact KDCs are associated with the whole range of birth and merger times, the less compact KDCs tend to have earlier births and mergers (the left panels of Fig. 9). All 18 KDCs with rKDC/reff > 3 were born more than 4 Gyr ago. These 18 KDCs have a slightly lower rate of associated mergers (8 out of 18) than average, but they do not seem to be exceptional in any way. In one to three cases, the KDC experienced some size growth. However, they were born large more often, in some cases even too large to satisfy our criteria for KDCs, but their size or relative size gets smaller over time.
In addition, the KDC relative size does not seem to be correlated with either merger mass ratio or the amount of gas present during the KDC birth, as shown in Fig. 10. Horizontal axes of both panels show the KDC relative size and the symbol colors code the time of the KDC birth. The left panel shows the relative size versus the merger gas fraction for the 81 KDCs with associated mergers (see Sect. 2.3). The gas fraction was measured at the same time as the merger stellar-mass ratio (see Sect. 2.3) as the sum of the gas mass of both merger progenitors divided by the sum of the baryonic masses. The circle sizes are proportional to the merger stellar-mass ratio. The gas fraction corresponds to the birth time nicely as the galaxies in the early universe generally had a higher gas fraction.
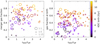 |
Fig. 10. Left panel: KDC relative size rKDC/reff versus the total merger gas fraction for 81 KDCs with associated mergers. Right panel: KDC relative size versus the total gas fraction at the time of the KDC births for all 134 KDCs. In both panels, the look-back time of the KDC birth is color coded and, for the KDCs with associated mergers, the circle sizes are proportional to the merger stellar-mass ratio. KDCs without associated mergers are represented by the square symbols. |
The right panel of Fig. 10 shows the relative size versus the gas fraction of the KDC host at the time of the KDC birth. KDCs with associated mergers are represented with the same symbols as in the left panel, KDCs without associated mergers are represented with squares. The host gas fraction at the KDC birth is lower than the merger gas fraction for 76 out of 81 KDCs with associated mergers. On average, 67% of the initial gas amount is left in the system after the merger. None of the quantities show a clear trend with the KDC relative size.
2.6. Examples of KDC origins
In this section, we show four examples of the KDCs from our sample in more detail. We use the same galaxies as displayed in Fig. 1 (maps of surface density and line-of-sight kinematics) and Fig. 2 (radial profiles of v⊥,mean and α(Lin, Lout)). Properties of these galaxies and their KDCs are listed in Table 1. Two of these galaxies (#140593 and #353280) had an associated merger, the other two (#394799 and #354838) had the last merger (bigger than 1:15) several gigayears before their KDC emerged.
Figure 11 shows histograms of stellar ages for all four galaxies. The magenta vertical lines indicate the KDC birth. The black lines denote all the mergers undergone by the galaxy (see Sect. 2.3). The numbers indicate stellar-mass ratios of the mergers, for example “13” means a merger of 1:13. The histograms were computed from the ages of the stellar particles present in the galaxy in the last snapshot. The red part corresponds to all stellar particles, and yellow corresponds to the particles inside rKDC. Inside rKDC, there is 29, 35, 43, and 45% of the total stellar matter for galaxy #140593, #353280, #394799, and #354838, respectively. The blue histograms include particles inside rKDC that contribute to KDC rotation. They were selected iteratively in the following manner: the angular momentum LKDC of particles was calculated and only particles with angular momentum vectors within π/6 from the direction of LKDC were retained. The procedure starts with all particles inside rKDC and continues until convergence. Particles included in the blue histograms represent 33, 28, 17, and 24% of the stellar matter inside rKDC for galaxy #140593, #353280, #394799, and #354838, respectively.
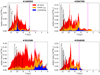 |
Fig. 11. Histograms of stellar ages of the four examples of Illustris galaxies with KDCs (properties of the galaxies are listed in Table 1). The black and magenta vertical lines indicate the look-back time of the mergers and KDC birth, respectively. The numbers indicate the stellar-mass ratios of the mergers, e.g., “13” means a merger of 1:13. |
Galaxy #140593 (the top left panels of Figs. 1, 2, and 11) underwent ten mergers 12.2–9.2 Gyr ago. After three quiescent gigayers, it suffered a major, 1:1, merger 6.1 Gyr ago and the KDC appeared just one snapshot later. Figure 12 captures different stages of the merger. Exceptionally, in this figure, the xy corresponds to the collision plane (not the principal axes of the galaxy). The merger progenitors had the first pericentric passage 7.4 Gyr ago and merged shortly after the second pericentric passage around 6 Gyr. In addition to the KDC, prolate rotation emerged during the merger as well. This galaxy was also a part of our sample of 59 Illustris prolate rotators published in Ebrová & Łokas (2017). The direction of the overall prolate rotation remains stable in the simulation box for the whole 6 Gyr after the merger. On the other hand, the direction of the rotation axis of the KDC slowly changes, causing the KDC to disappear for a while in some projection planes. For example, the KDC is visible in the merger plane (the middle column of Fig. 12) after the merger and also at the end of the simulation, but it disappears around the look-back time 1.63 Gyr. However, any time after the merger, there are planes in which the KDC is clearly visible and distinct for the whole 6 Gyr.
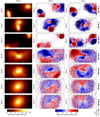 |
Fig. 12. Snapshots of the major merger and the subsequent evolution of galaxy #140593. The xy corresponds to the collision plane. Left column: surface density. Middle and right column: mean line-of-sight velocity in two different projections. The look-back time for each snapshot is indicated on the right. The size of each box is 176 × 88 kpc. |
Figure 13 shows the situation in galaxy #140593 at the end of the simulation, z = 0, in the same projection plane, divided into components according to their origin. Maps in the first column include all stellar particles; the second (third) column includes only particles that were already present in the primary (secondary) progenitor before the merger; and the last column takes only stellar particles that formed after the merger into account. We see that the large-scale prolate rotation is ensured by the particles that originated in the secondary progenitor, despite the fact that the particles from the primary display a large-scale prolate rotation in the opposite direction. The KDC mostly consists of the old particles from the primary that managed to maintain the original disky rotation. The end of the merger was accompanied by the black hole activity and a significant gas loss (about three-quarters of the total gas amount). Star formation was considerably suppressed during and after the merger (see also the top left panel of Fig. 11), but some stars (1.7% of the total stellar matter) formed after the merger to mostly support the KDC rotation.
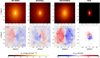 |
Fig. 13. Maps of the stellar surface brightness and the mean line-of-sight velocity for galaxy #140593 viewed along the 3D minor axis in the last snapshot, z = 0, divided into components according to their origin. The fields of view correspond to 1.5 × 1.5 rmax. |
Galaxy #353280 (the bottom left panels of Figs. 1, 2, and 11) underwent a relatively small, 1:6, merger 4.5 Gyr ago and the KDC appeared shortly after that. The KDC rotation is partially supported by the stars that formed in the primary progenitor prior to the merger, but it mostly consists of stars that formed during the period of increased star formation after the merger. At the time of the KDC birth, the primary was a gas-rich galaxy with the gas fraction of 0.6 before and 0.5 after the merger. However, there was a 2-Gyr period of lower star formation prior to the KDC formation, which was possibly due to the ongoing merger, and it was only until the end of the merger that a significant number of stars formed with angular momenta supporting the KDC rotation. The KDC even survived a subsequent, more major, 1:3, merger 0.5 Gyr before the end of the simulation.
Galaxies #394799 and #354838 (the top and bottom right panels, respectively, in Figs. 1, 2, and 11) experienced a series of mergers, but, in both cases, the last merger happened more than 3 Gyr before the KDC birth. At the time of the KDC birth, galaxy #394799 was very isolated, that is to say no subhalo was more massive than 10% of the galaxy (in baryonic component) to the distance of at least 1.6 Mpc. The KDC rotation was mostly supported by stellar particles that formed about 3.5 Gyr before the KDC was born. Galaxy #354838 experienced the first pericentric passage of a smaller subhalo (about 20% of the baryonic mass of the primary) in the distance of about 130 kpc at the time of the KDC birth. The subhalo continued to orbit the galaxy and was about to merge at the end of the simulation, more than 6 Gyr after the first pericenter passage. After the KDC was born, the black hole in the host galaxy went through an active phase accompanied by significant gas loss (change in the gas fraction from 0.5 to 0.3) and the star formation was suppressed to a very small amount within about 1 Gyr after the KDC birth. At the end of the simulation, only 0.55% of the host stellar mass was younger than 5 Gyr. Nevertheless, a large portion of stars that were formed during this 1-Gyr period after the KDC birth support the KDC rotation together with a large number of stars 1–3 Gyr older than the KDC. Figure 14 shows a selection of snapshots from the evolution of galaxy #354838. The KDC emerged quite abruptly and it was visible in all projection planes in look-back times 6.4–2.4 Gyr. After that, it disappeared in the xy plane, but it emerged again after about 0.5 Gyr. The orientation of the projection planes was derived in the last snapshot, but it was kept the same for all outputs, as described in Sect. 2.2.
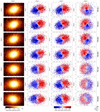 |
Fig. 14. Snapshots of the evolution of galaxy #354838, x, y, and z correspond to the major, intermediate, and minor axis of the galaxy at the end of the simulation. The look-back time for each snapshot is indicated on the right. The fields of view correspond to 1.5 × 1.0rmax. |
3. Discussion
We examined our sample of 134 galaxies with KDCs that were visually selected from the last snapshot of the Illustris simulation. Due to the limited Illustris resolution of individual galaxies, our sample covers larger diameters of kinematically distinct components than most of the KDCs traditionally identified in observations. McDermid et al. (2006) reported KDC radii 0.1–1.6 kpc in the SAURON and OASIS data. Koprolin & Zeilinger (2000) found typical KDC radii of 0.4 kpc, while KDC in Mehlert et al. (1998) and Hau & Forbes (2006) had sizes of 1.4–6.4 kpc. The smallest KDC radius in our sample is 2.5 kpc, and half of our KDCs have rKDC < 10 kpc, but two of the biggest KDCs reach up to a 35 kpc radius. However, the properties of the KDCs and their hosts as well as their formation histories do not seem to depend on the relative sizes of the KDCs (Sects. 2.4 and 2.5, Figs. 8–10). Thus, including more extended KDCs does not skew our statistics on the Illustris KDCs.
Generally, the Illustris KDCs and their host galaxies are a very diverse group. For the well-resolved part of the sample (above a host stellar mass of 7.4 × 10¹⁰ M⊙), the host masses follow the general distribution of the Illustris galaxies, with a possible slight preference for more massive galaxies (Sect. 2.1, Fig. 3). This is in contrast with another kinematical peculiarity – prolate rotation, which shows a clear preference for more massive galaxies in the observations (Tsatsi et al. 2017; Krajnović et al. 2011) as well as in the Illustris simulation (Ebrová & Łokas 2017). In the Illustris simulation, the vast majority of prolate rotators originate in mergers. Also, merger signs are more frequent among the high-mass galaxies (Tal et al. 2009; Bílek et al. 2020). Thus, the mass distribution of the KDC hosts alone indicates that the KDCs are an inherently different group of kinematical peculiarity and that their formation mechanism must be, at least in a significant part, different from the prolate rotation. Indeed, only about half of the KDC origins can be directly connected to a merger event (see below). Moreover, compared to the prolate rotation, many KDCs emerged quite early (see below). Early on, the mergers were much more frequent for all types of galaxies and the other signs of these early mergers (apart from the KDCs) are mostly undetectable at the redshift z = 0.
In the well-resolved part, we detected KDCs in 8% (90 out of 1160) of Illustris galaxies. We counted all KDCs that were visible in at least one of the projections on the three principal planes of the host galaxy. For the whole sample of 134 galaxies, 44, 45, and 45 KDCs were visible in one, two, and three planes, respectively, making the KDCs, on average, visible almost exactly in two projections out of the three possibilities. That implies a roughly  % detection rate in the observation among all galaxies above the stellar mass 7.4 × 10¹⁰ M⊙. The observed KDC incidence among early-type galaxies is around 13% in the ATLAS3D complete volume- and magnitude-limited sample of 260 ETGs and it ranges from 2 to 33% in other observed samples of ETGs (see Sect. 1). The morphological types of the Illustris galaxies are not unequivocally determined, but if we assume that all KDC hosts in our sample are ETGs and that ETGs account for 30% of all galaxies, the Illustris KDC sample would imply a 17% detection rate among the ETGs. However, since our range of KDC sizes differs from the range in observed samples, this percentage is not easily compared with the available observations.
KDCs can be long-lived and resilient features. The times of their births are distributed roughly uniformly between look-back times 0 and 11.4 Gyr (Sect. 2.2, Fig. 4). From our sample, 35 KDCs (26%) survived a subsequent merger or multiple mergers (with a stellar-mass ratio of at least 1:15), which occurred at least 1 Gyr after the KDC birth. These subsequent mergers or flybys work both ways – some of them make the KDC more prominent or compact, and some make it more extended or weaker.
There is no single channel of KDC formation, but mergers seem to be the main formation mechanism – 81 (60%) KDCs have an associated merger (Sect. 2.3). The association between mergers and KDC births is especially strong for more massive hosts (the top left panel of Fig. 9) and for major mergers (Fig. 6). In the major-merger simulations of Hoffman et al. (2010), KDCs were only found in remnants with the initial gas fraction of at least 0.15 and most of them were found in 0.15–0.2. In our sample, there are only two KDCs with an initial gas fraction around 0.05, other associated mergers have at least 0.2, and there are also plenty very gas-rich associated mergers (the left panel of Fig. 10). The gas fraction at the time of the KDC birth (the right panel of Fig. 10) is, on average, about 20% lower than the initial merger gas fraction.
The KDCs without associated mergers can be formed during earlier pericentric passages of the merger progenitors, but the passages happened too soon before the merger for it to count as an associated merger. Others formed during a flyby of another galaxy, which did not lead to a merger event. Some hosts formed (usually during mergers) rapidly rotating cores, which have angular momenta aligned with the global host rotation, and only later on does the core change the orientation of the rotation axis. This can happen after another merger and in this case, the KDCs falls into the category of associated mergers. Other KDCs form without an obvious external cause. Roughly between 9 and 25 KDCs formed in a time period without a merger, pericentric passage, or flyby, depending on the limits on the galaxy masses (or mass ratios), distance, and allowed time difference between the event and the KDC birth. These KDCs are more frequent among lower-mass hosts, which is to be expected as lower-mass hosts are generally less likely to have a KDC birth associated with a merger (see the top left panel of Fig. 9).
Díaz & Dottori (2016) propose that some observed KDCs can be warped disks observed in face-on projections. Generally, this phenomenon cannot account for a large portion of our sample, since, even though we specifically examined face-on projections, our KDCs are more likely to be found in the edge-on projections. KDCs are detected in the zy-plane twice as often as in the xy-plane, while the detection rate in zy and xz-plane is about the same. Nevertheless, we found one or two KDCs that can actually result from this type of mechanism. These KDCs also show a change in their rotation axis, which can reflect the evolution of the warp.
The change in the KDC rotation axis is a common phenomenon among the Illustris KDCs. Some degree of more or less regular precession occurs in more than half of the KDCs for at least part of their lifetimes, regardless of the KDC origin (with or without the associated merger). Schulze et al. (2017) report the precession for their KDC that formed in a simulation of equal-mass spiral progenitors. This KDC reportedly dissolved after about 3 Gyr due to the precession motion. In our Illustris KDC sample, we do not see any correlation between the precession and the KDC lifespan. There are six KDCs with especially pronounced precession in our sample. Four of them emerged during mergers, with close-to-equal mass ratios between 5.3 and 10 Gyr ago. The precession was only evaluated in periods without significant mergers, in which the global rotation and orientation of the galaxy is stable in the simulation box or changes very slowly compared to the KDC precession.
There is basically no correlation between the time of the merger closest to the KDC birth and the mean mass-weighted stellar age of the KDC (the bottom right panel of Fig. 9), but the relation between the KDC birth and KDC stellar age exists (the bottom left panel of Fig. 9). In both groups – with or without the associated mergers (Sect. 2.5) – we found the stellar age to be roughly the same as the look-back time of the KDC birth for a quarter of the galaxies; the rest of the galaxies show an older stellar age than the look-back time of the KDC birth. This means that even though KDCs can be long-lived features, an old stellar population inside the KDC radius does not automatically mean that the KDC exists there for a long time. On the other hand, younger KDC stellar ages indicate recently-born KDCs.
The existence of the relation between the KDC birth and KDC stellar age can be partially explained by the fact that the KDC birth is also often associated with a sudden loss of a significant amount of gas in the host galaxy. For KDCs with the stellar age within ±1 Gyr from the KDC birth, 58% (20 out of 34) have an associated sudden gas loss. The remaining 100 KDCs have a stellar age more than 1 Gyr older than the birth and 30% of them have a gas loss event associated with the KDC birth. From these 50 cases (37%) of associated gas loss, 37 happened during mergers (i.e., 46% of the KDCs with associated mergers). For the KDCs without associated mergers, 13 KDCs (25%) have the KDC birth associated with the gas loss event. These events can be connected to the AGN activity or flybys of other galaxies.
Even though our KDC sample covers a different range of KDC sizes, it partially recovers the relation between size and age reported by McDermid et al. (2006) for the KDCs in the SAURON sample, that is to say KDCs with older stellar ages cover a wide range of sizes, while younger stars are associated with a smaller rKDC (the first panel of Fig. 8). However, in our case, the trend mostly disappears when the graph is corrected for the relative sizes of the KDCs (the middle panel of Fig. 8).
In the ATLAS3D sample, around 30% of KDC hosts are classified as Double σ (2σ) galaxies. This feature is thought to be a signature of two counter-rotating, co-spatial components (Krajnović et al. 2011) and have been reproduced in merger simulations (Jesseit et al. 2007; Bois et al. 2011). Krajnović et al. (2011) defined 2σ as two off-center, but symmetric, peaks in the velocity dispersion, which lie on the major axis of the galaxy, with the distance between the peaks being at least half of the effective radius. They found them in the ATLAS3D sample by visually inspecting velocity dispersion maps. We performed the visual inspection of the velocity dispersion maps of our sample of Illustris KDC hosts and found between 23 (counting only clear cases) and 50 (also including likely and possible cases) 2σ peak galaxies, that is to say 17–37%. In the vast majority of cases, the 2σ peaks are recorded in the same projection plane (or planes) as the KDCs. Only 43% of the clear cases of 2σ KDC hosts have associated mergers. The top row of Fig. 15 shows galaxy #300341 – an example of a 2σ galaxy among our Illustris KDC hosts. We found additional 12–15 galaxies that have symmetric peaks in the velocity dispersion lying on the minor axis. Nine of these galaxies show prolate or prolate-like large-scale rotation, out of which six have associated mergers. The bottom row of Fig. 15 shows galaxy #11 – an example of an Illustris KDC host with large-scale prolate rotation and two peaks of the velocity dispersion on the minor axis.
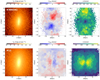 |
Fig. 15. Examples of two Illustris KDC hosts that show two peaks in their maps of the velocity dispersion. The fields of view correspond to 6 × 6 reff. |
Around 20 KDC hosts show some kind of ring or oval shaped structure in the velocity dispersion maps. Interestingly enough, there are four cases of counter-rotating disks in our KDC sample and all four galaxies show this ring or oval-shaped feature. Two KDCs show a complicated structure in the mean line-of-sight velocity fields. Galaxy #216740 – the left part of Fig. 16 – seems to be a KDC nested in a larger KDC. This qualitatively resembles the inner structure of NGC 4528 (see Fig. C5 in Krajnović et al. 2011). Galaxy #216740 underwent two merging periods. The first one was 7.7–6.9 Gyr ago with two mergers, 1:1.5 and 1:5.0, after which the galaxy developed prolate rotation with a rapidly rotating core. The core maintained the rotation aligned with the host for about 4 Gyr and became decoupled 3.2 Gyr ago during a penultimate pericenter passage of a galaxy, with the mass ratio 1:1.7, which merged with the host 2.7 Gyr ago. After the merger, the host regained more oblate-like rotation and the KDC acquired the nested appearance. The other galaxy with a complicated KDC structure, #354955 – the right part of Fig. 16 – appears to have two perpendicular disks in its center. Its KDC emerged 8.6 Gyr ago without an associated merger. After a series of mergers (1:11, 1:1.4, and 1:3.1) 6.2–4.5 Gyr ago, the KDC gained the disky shape and gradually changed the rotation-axis direction by at least 90° between the last merger and the end of the simulation.
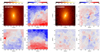 |
Fig. 16. Examples of two Illustris galaxies with a complicated kinematic structure in the KDCs. The fields of view correspond to 1.5 × 1.5 rmax. |
The presence of a KDC may be correlated with other morphological features indicating a possible past merger in the history of the galaxy, such as is the case of the so-called shell galaxies. Shell galaxies are mostly early-type galaxies that possess, in their stellar component, a low surface brightness structure in the form of concentric arcs. Shell galaxies have been believed to result from close-to-radial minor mergers for decades (Quinn 1984; Dupraz & Combes 1986; Hernquist & Quinn 1988; Ebrová et al. 2012), but recently the view concerning their origin has shifted from minor mergers to intermediate-mass (Duc et al. 2015; Ebrová et al. 2020) or even major ones (Pop et al. 2018).
In the 1990s, there was a suspected association between KDCs and the stellar shells. As stated in Hau et al. (1999), the strong association comes from the finding by Forbes (1992) that, at the time, all of the nine well-established KDCs and a further four out of the six “possible KDCs” hosts possess stellar shells. In the current observational data, the association is much weaker – from the 38 KDCs from the ATLAS3D and SAURON sample (McDermid et al. 2006; Emsellem et al. 2007; Krajnović et al. 2011), to our knowledge, only 12 hosts (31%) are known shell galaxies. Moreover, Michard & Prugniel (2004) examined a sample of 117 ellipticals and found KDCs at a comparable rate (around 16%) in the groups of galaxies with and without morphological peculiarities.
We found 71 (53%) shell galaxies in our sample of Illustris KDCs, although some of the shell galaxies can only be reliably identified in the images with a field of view larger than 2 × 2 rmax. For example, galaxy #140593 has clearly visible shells in the inner parts shortly after the merger (see the snapshot at look-back time 5.44 Gyr in Fig. 12), but at the end of the simulation, the shells are still clearly visible in the outer parts of the galaxy. Naturally, not all of these shells are connected to the KDC origin, since 11 (21%) shell galaxies are in the group of the KDC hosts without associated mergers. In the group with associated mergers, 60 (74%) KDC hosts possess shells. Incidence of the shells is the highest for the KDCs that were recently created in mergers – of all 29 KDC hosts that had an associated merger during the last 4.5 Gyr, all but one have visible stellar shells.
We compared these findings with the sample of 59 Illustris prolate rotators (Ebrová & Łokas 2017); since the vast majority of them were created in a merger during the last 6 Gyr of the simulation, we expect a higher rate of shell galaxies. We inspected the surface-brightness maps of the prolate rotators (constructed in the same way as for the KDC hosts) and found 40 (68%) shell galaxies. This is not much higher than the KDC sample, but the prolate rotators have a higher share of low-mass galaxies since the prolate rotation is easier to detect than KDCs in galaxies with lower numbers of particles. However, the shells are not easily recognized in the low-resolution data and they dissolve faster in low-mass galaxies. In the well-resolved mass (above 7.4 × 10¹⁰ M⊙), shells are found in 74% (67 out of 90) of KDC hosts and 94% (17 out of 18) of prolate rotators. Based on the Illustris data, we predict the incidence of shells (or tidal features in general) to be higher in prolate rotators than in the KDC hosts.
4. Conclusions
We used the publicly available data of the large-scale cosmological simulation Illustris that follows a coevolution of dark and baryonic matter. We visually inspected kinematical maps of all 7697 galaxies that have more than 104 stellar particles in the final output (redshift z = 0) of the Illustris-1 run. We identified 134 galaxies with kinematically distinct cores (KDCs).
We determined look-back times for the KDC births and analyzed merger histories of the KDC hosts. We divided our sample into two groups according to the KDC origin: (1) 81 galaxies that have the KDC birth associated with a merger event, and (2) 53 galaxies without an associated merger.
We summarize our findings as follows:
-
equal portions of the KDCs are detectable in one, two, and three projection planes with the least probability of detection in the face-on projection;
-
for the well-resolved galaxies, the host masses follow the general distribution of the Illustris galaxies, with a possible slight preference for more massive galaxies;
-
KDCs can be long-lived features – their births are distributed, roughly uniformly, between look-back times 0 and 11.4 Gyr;
-
there is no single channel of KDC formation;
-
mergers seem to be the main formation mechanism – 60% of KDCs emerged during (or shortly after) a merger event;
-
other KDCs formed during a pericentric passage or flyby of another galaxy, by a precession of a previously formed rapidly rotating core, or without an obvious external cause;
-
the association between mergers and KDC births is especially strong for more massive hosts and for major mergers;
-
the mean mass-weighted stellar age of the KDC is either about the same as the look-back time of the KDC birth or older, that is to say an old stellar population of the KDC does not automatically imply an early KDC formation;
-
one quarter of KDCs have similar values for the KDC stellar age and the KDC birth time (regardless of the KDC origin);
-
we partially recovered the KDC size-age trend reported by McDermid et al. (2006), but it mostly disappears when corrected for the KDC relative sizes;
-
the KDC birth is associated with a sudden loss of gas from the host for 46% of the KDCs with associated mergers and 25% of KDCs without them;
-
KDCs can survive even major or multiple subsequent mergers;
-
more than half of the KDCs, regardless of their origin, experienced a precession in their kinematic axis, but the most pronounced precession occurs for KDCs that emerged during major mergers;
-
around a quarter of the KDC hosts (with a mild preference for KDCs without associated mergers) have 2σ peaks in their velocity dispersion maps;
-
there is a strong association between a KDC and stellar shells for the KDCs born in the associated merger during the last 4.5 Gyr; and
-
based on the Illustris data, we predict the incidence of the shells (or tidal features in general) to be higher in prolate rotators than in the KDC hosts.
In this work, we presented the largest sample of KDCs drawn from a single theoretical study to date. We showed that the KDC hosts in Illustris are a rather heterogeneous group with different times and channels of formation. Mergers seem to be the direct cause of formation for about half of the KDCs. These KDCs are not very different from the rest, except that they are more likely to have massive hosts and that the KDCs recently formed in mergers are strongly associated with tidal features.
We note that snapshots 53 and 55 from the Illustris-1 run are not available.
Acknowledgments
We thank the referee for valuable comments that helped improve the manuscript. This work was supported in part by the Polish National Science Centre under Grant 2017/26/D/ST9/00449 (IE).
References
- Algorry, D. G., Navarro, J. F., Abadi, M. G., et al. 2014, MNRAS, 437, 3596 [NASA ADS] [CrossRef] [Google Scholar]
- Balcells, M., & González, A. C. 1998, ApJ, 505, L109 [NASA ADS] [CrossRef] [Google Scholar]
- Balcells, M., & Quinn, P. J. 1990, ApJ, 361, 381 [NASA ADS] [CrossRef] [Google Scholar]
- Bender, R. 1988, A&A, 202, L5 [NASA ADS] [Google Scholar]
- Bendo, G. J., & Barnes, J. E. 2000, MNRAS, 316, 315 [NASA ADS] [CrossRef] [Google Scholar]
- Bílek, M., Duc, P.-A., Cuillandre, J.-C., et al. 2020, MNRAS, 498, 2138 [Google Scholar]
- Bois, M., Emsellem, E., Bournaud, F., et al. 2011, MNRAS, 416, 1654 [NASA ADS] [CrossRef] [Google Scholar]
- Bundy, K., Bershady, M. A., Law, D. R., et al. 2015, ApJ, 798, 7 [NASA ADS] [CrossRef] [Google Scholar]
- Cappellari, M. 2016, ARA&A, 54, 597 [NASA ADS] [CrossRef] [Google Scholar]
- Cappellari, M., Emsellem, E., Bacon, R., et al. 2007, MNRAS, 379, 418 [NASA ADS] [CrossRef] [Google Scholar]
- Cappellari, M., Emsellem, E., Krajnović, D., et al. 2011, MNRAS, 413, 813 [NASA ADS] [CrossRef] [Google Scholar]
- Coccato, L., Morelli, L., Corsini, E. M., et al. 2011, MNRAS, 412, L113 [NASA ADS] [CrossRef] [Google Scholar]
- Croom, S. M., Lawrence, J. S., Bland-Hawthorn, J., et al. 2012, MNRAS, 421, 872 [NASA ADS] [Google Scholar]
- de Zeeuw, P. T., Bureau, M., Emsellem, E., et al. 2002, MNRAS, 329, 513 [NASA ADS] [CrossRef] [Google Scholar]
- Díaz, R. J., & Dottori, H. 2013, Mem. Soc. Astron. It. Suppl., 25, 37 [Google Scholar]
- Díaz, R. J., & Dottori, H. 2016, Int. J. Astron. Astrophys., 6, 198 [Google Scholar]
- Du, Q., Faber, V., & Gunzburger, M. 1999, SIAM Rev., 41, 637 [Google Scholar]
- Duc, P.-A., Cuillandre, J.-C., Karabal, E., et al. 2015, MNRAS, 446, 120 [Google Scholar]
- Dupraz, C., & Combes, F. 1986, A&A, 166, 53 [NASA ADS] [Google Scholar]
- Ebrová, I., & Łokas, E. L. 2017, ApJ, 850, 144 [NASA ADS] [CrossRef] [Google Scholar]
- Ebrová, I., Jílková, L., Jungwiert, B., et al. 2012, A&A, 545, A33 [NASA ADS] [CrossRef] [EDP Sciences] [Google Scholar]
- Ebrová, I., Bílek, M., Yıldız, M. K., & Eliášek, J. 2020, A&A, 634, A73 [CrossRef] [EDP Sciences] [Google Scholar]
- Efstathiou, G., Ellis, R. S., & Carter, D. 1982, MNRAS, 201, 975 [NASA ADS] [Google Scholar]
- Emsellem, E., Cappellari, M., Krajnović, D., et al. 2007, MNRAS, 379, 401 [Google Scholar]
- Emsellem, E., Cappellari, M., Krajnović, D., et al. 2011, MNRAS, 414, 888 [Google Scholar]
- Ene, I., Ma, C.-P., Veale, M., et al. 2018, MNRAS, 479, 2810 [NASA ADS] [CrossRef] [Google Scholar]
- Evans, N. W., & Collett, J. L. 1994, ApJ, 420, L67 [NASA ADS] [CrossRef] [Google Scholar]
- Forbes, D. A. 1992, PhD Thesis, Univ. Cambridge, UK [Google Scholar]
- Franx, M., & Illingworth, G. D. 1988, ApJ, 327, L55 [NASA ADS] [CrossRef] [Google Scholar]
- González-García, A. C., Aguerri, J. A. L., & Balcells, M. 2005, A&A, 444, 803 [NASA ADS] [CrossRef] [EDP Sciences] [Google Scholar]
- Graham, M. T., Cappellari, M., Li, H., et al. 2018, MNRAS, 477, 4711 [Google Scholar]
- Harsoula, M., & Voglis, N. 1998, A&A, 335, 431 [NASA ADS] [Google Scholar]
- Hau, G. K. T., & Forbes, D. A. 2006, MNRAS, 371, 633 [NASA ADS] [CrossRef] [Google Scholar]
- Hau, G. K. T., & Thomson, R. C. 1994, MNRAS, 270, L23 [NASA ADS] [Google Scholar]
- Hau, G. K. T., Carter, D., & Balcells, M. 1999, MNRAS, 306, 437 [NASA ADS] [CrossRef] [Google Scholar]
- Hernquist, L., & Quinn, P. J. 1988, ApJ, 331, 682 [NASA ADS] [CrossRef] [Google Scholar]
- Hinshaw, G., Larson, D., Komatsu, E., et al. 2013, ApJS, 208, 19 [Google Scholar]
- Hoffman, L., Cox, T. J., Dutta, S., & Hernquist, L. 2010, ApJ, 723, 818 [NASA ADS] [CrossRef] [Google Scholar]
- Iodice, E., Sarzi, M., Bittner, A., et al. 2019, A&A, 627, A136 [NASA ADS] [CrossRef] [EDP Sciences] [Google Scholar]
- Janz, J., Penny, S. J., Graham, A. W., Forbes, D. A., & Davies, R. L. 2017, MNRAS, 468, 2850 [NASA ADS] [CrossRef] [Google Scholar]
- Jedrzejewski, R., & Schechter, P. L. 1988, ApJ, 330, L87 [NASA ADS] [CrossRef] [Google Scholar]
- Jesseit, R., Naab, T., Peletier, R. F., & Burkert, A. 2007, MNRAS, 376, 997 [NASA ADS] [CrossRef] [Google Scholar]
- Johnston, E. J., Merrifield, M. R., Aragón-Salamanca, A., & Cappellari, M. 2013, MNRAS, 428, 1296 [NASA ADS] [CrossRef] [Google Scholar]
- Kannappan, S. J., & Fabricant, D. G. 2001, AJ, 121, 140 [NASA ADS] [CrossRef] [Google Scholar]
- Khochfar, S., Emsellem, E., Serra, P., et al. 2011, MNRAS, 417, 845 [NASA ADS] [CrossRef] [Google Scholar]
- Koprolin, W., & Zeilinger, W. W. 2000, A&AS, 145, 71 [NASA ADS] [CrossRef] [EDP Sciences] [Google Scholar]
- Kormendy, J. 1984, ApJ, 287, 577 [NASA ADS] [CrossRef] [Google Scholar]
- Krajnović, D., Cappellari, M., de Zeeuw, P. T., & Copin, Y. 2006, MNRAS, 366, 787 [NASA ADS] [CrossRef] [Google Scholar]
- Krajnović, D., Bacon, R., Cappellari, M., et al. 2008, MNRAS, 390, 93 [NASA ADS] [CrossRef] [Google Scholar]
- Krajnović, D., Emsellem, E., Cappellari, M., et al. 2011, MNRAS, 414, 2923 [NASA ADS] [CrossRef] [Google Scholar]
- Krajnović, D., Emsellem, E., den Brok, M., et al. 2018, MNRAS, 477, 5327 [NASA ADS] [CrossRef] [Google Scholar]
- Kuijken, K., Fisher, D., & Merrifield, M. R. 1996, MNRAS, 283, 543 [NASA ADS] [CrossRef] [Google Scholar]
- Kuntschner, H., Emsellem, E., Bacon, R., et al. 2010, MNRAS, 408, 97 [NASA ADS] [CrossRef] [Google Scholar]
- Lloyd, S. 1982, IEEE Trans. Inf. Theory, 28, 129 [Google Scholar]
- Loubser, S. I. 2009, PhD Thesis, University of Central Lancashire, UK [Google Scholar]
- McDermid, R. M., Emsellem, E., Shapiro, K. L., et al. 2006, MNRAS, 373, 906 [Google Scholar]
- Mehlert, D., Saglia, R. P., Bender, R., & Wegner, G. 1998, A&A, 332, 33 [NASA ADS] [Google Scholar]
- Merrifield, M. R., & Kuijken, K. 1994, ApJ, 432, 575 [NASA ADS] [CrossRef] [Google Scholar]
- Michard, R., & Prugniel, P. 2004, A&A, 423, 833 [NASA ADS] [CrossRef] [EDP Sciences] [Google Scholar]
- Mitzkus, M., Cappellari, M., & Walcher, C. J. 2017, MNRAS, 464, 4789 [Google Scholar]
- Moody, C. E., Romanowsky, A. J., Cox, T. J., Novak, G. S., & Primack, J. R. 2014, MNRAS, 444, 1475 [NASA ADS] [CrossRef] [Google Scholar]
- Nedelchev, B., Coccato, L., Corsini, E. M., et al. 2019, A&A, 623, A87 [NASA ADS] [CrossRef] [EDP Sciences] [Google Scholar]
- Nelson, D., Pillepich, A., Genel, S., et al. 2015, Astron. Comput., 13, 12 [NASA ADS] [CrossRef] [Google Scholar]
- Pizzella, A., Corsini, E. M., Vega Beltrán, J. C., & Bertola, F. 2004, A&A, 424, 447 [NASA ADS] [CrossRef] [EDP Sciences] [Google Scholar]
- Pizzella, A., Morelli, L., Corsini, E. M., et al. 2014, A&A, 570, A79 [NASA ADS] [CrossRef] [EDP Sciences] [Google Scholar]
- Pop, A.-R., Pillepich, A., Amorisco, N. C., & Hernquist, L. 2018, MNRAS, 480, 1715 [NASA ADS] [CrossRef] [Google Scholar]
- Quinn, P. J. 1984, ApJ, 279, 596 [NASA ADS] [CrossRef] [Google Scholar]
- Rantala, A., Johansson, P. H., Naab, T., Thomas, J., & Frigo, M. 2019, ApJ, 872, L17 [NASA ADS] [CrossRef] [Google Scholar]
- Ricci, T. V., Steiner, J. E., & Menezes, R. B. 2016, MNRAS, 463, 3860 [NASA ADS] [CrossRef] [Google Scholar]
- Rodriguez-Gomez, V., Genel, S., Vogelsberger, M., et al. 2015, MNRAS, 449, 49 [NASA ADS] [CrossRef] [Google Scholar]
- Sánchez, S. F., Kennicutt, R. C., Gil de Paz, A., et al. 2012, A&A, 538, A8 [NASA ADS] [CrossRef] [EDP Sciences] [Google Scholar]
- Schulze, F., Remus, R.-S., & Dolag, K. 2017, Galaxies, 5, 41 [NASA ADS] [CrossRef] [Google Scholar]
- Schulze, F., Remus, R.-S., Dolag, K., et al. 2018, MNRAS, 480, 4636 [NASA ADS] [CrossRef] [Google Scholar]
- Schwarzschild, M. 1979, ApJ, 232, 236 [NASA ADS] [CrossRef] [Google Scholar]
- Springel, V. 2010, MNRAS, 401, 791 [NASA ADS] [CrossRef] [Google Scholar]
- Statler, T. S. 1991, AJ, 102, 882 [NASA ADS] [CrossRef] [Google Scholar]
- Tal, T., van Dokkum, P. G., Nelan, J., & Bezanson, R. 2009, AJ, 138, 1417 [NASA ADS] [CrossRef] [Google Scholar]
- Taylor, P., Federrath, C., & Kobayashi, C. 2018, MNRAS, 479, 141 [Google Scholar]
- Toloba, E., Guhathakurta, P., van de Ven, G., et al. 2014, ApJ, 783, 120 [NASA ADS] [CrossRef] [Google Scholar]
- Tsatsi, A., Macciò, A. V., van de Ven, G., & Moster, B. P. 2015, ApJ, 802, L3 [NASA ADS] [CrossRef] [Google Scholar]
- Tsatsi, A., Lyubenova, M., van de Ven, G., et al. 2017, A&A, 606, A62 [NASA ADS] [CrossRef] [EDP Sciences] [Google Scholar]
- van den Bosch, R. C. E., van de Ven, G., Verolme, E. K., Cappellari, M., & de Zeeuw, P. T. 2008, MNRAS, 385, 647 [NASA ADS] [CrossRef] [Google Scholar]
- Vergani, D., Pizzella, A., Corsini, E. M., et al. 2007, A&A, 463, 883 [NASA ADS] [CrossRef] [EDP Sciences] [Google Scholar]
- Vogelsberger, M., Genel, S., Springel, V., et al. 2014a, Nature, 509, 177 [NASA ADS] [CrossRef] [Google Scholar]
- Vogelsberger, M., Genel, S., Springel, V., et al. 2014b, MNRAS, 444, 1518 [NASA ADS] [CrossRef] [Google Scholar]
All Tables
All Figures
|
Fig. 1. Examples of four Illustris galaxies with KDCs from our sample (properties of the galaxies are listed in Table 1). Each 2 × 2 segment of panels belongs to one galaxy with the maps of surface density and mean line-of-sight velocity viewed along the intermediate axis of the galaxy displayed in the top left and right panels, respectively. Lower left and right panels: mean line-of-sight velocity viewed along the minor and major axis, respectively. The fields of view corresponds to 1.5 × 1.5 rmax. |
| In the text | |
|
Fig. 2. Radial profiles of the mean tangential velocity, v⊥,mean, and the difference between the directions of the angular momenta inside and outside the given radius, α(Lin, Lout), for the stellar component of the four galaxies from Fig. 1. The quantities were measured in 3D and in the projection on three principal planes of the respective galaxy. Angles are expressed in radians. The black vertical lines denote the inferred KDC radius, rKDC. |
| In the text | |
|
Fig. 3. Comparison of the stellar mass distribution of the KDC hosts with the global sample. The distribution of the global sample was normalized to the same total number as for the KDC hosts. The gray histogram shows the mass distribution of the global sample for galaxies more massive than 7.4 × 10¹⁰ M⊙, which were normalized to the same number as the KDC hosts in the mass range. |
| In the text | |
|
Fig. 4. Histograms of time distribution of KDC births and mergers undergone by their host galaxies. The inset shows a zoom on the last 8 Gyr. |
| In the text | |
|
Fig. 5. Distribution of the snapshot difference between the KDC birth and the closest merger undergone by the host galaxy for the actual KDC births (in blue) compared to the distribution where the KDC births were permuted within the sample (in orange), with the bin size of three snapshots. The inset is a zoom around zero for the actual births, with the bin size of one snapshot. One snapshot is approximately 0.16 Gyr. |
| In the text | |
|
Fig. 6. Distributions of the stellar-mass ratios for associated mergers for the actual KDC births (in blue) and permuted KDC births (in orange). Upper panel: whole investigated period of 12.2 Gyr, lower panel: associated mergers for the last 8 Gyr of the simulation. The insets show the same distributions for tightly associated mergers. |
| In the text | |
|
Fig. 7. Correlation of the average of effective radii from de Vaucouleurs’ fits (reff) in the three principal projection planes of the respective galaxies with the half mass radius for stellar particles given by the Illustris subhalo catalog (HalfMassRad) for our KDC host sample at z = 0. The stellar mass of the host galaxies are color coded. |
| In the text | |
|
Fig. 8. KDC sizes versus the mass-weighted stellar ages inside rKDC. The first panel shows the actual physical sizes of the KDCs, and the other two panels show their relative size rKDC/reff. The stellar mass of the host galaxies at redshift z = 0 for the first two panels and the age difference between stars inside and outside rKDC (inner minus outer) for the last panel are color coded. |
| In the text | |
|
Fig. 9. Correlations between the time of the KDC birth and the associated or closest merger and the mass-weighted stellar age inside rKDC. The time labels are expressed in terms of the look-back time. Circle areas are proportional to the stellar mass of the galaxies at redshift z = 0. Colors reflect the relative sizes of the KDCs at z = 0. |
| In the text | |
|
Fig. 10. Left panel: KDC relative size rKDC/reff versus the total merger gas fraction for 81 KDCs with associated mergers. Right panel: KDC relative size versus the total gas fraction at the time of the KDC births for all 134 KDCs. In both panels, the look-back time of the KDC birth is color coded and, for the KDCs with associated mergers, the circle sizes are proportional to the merger stellar-mass ratio. KDCs without associated mergers are represented by the square symbols. |
| In the text | |
|
Fig. 11. Histograms of stellar ages of the four examples of Illustris galaxies with KDCs (properties of the galaxies are listed in Table 1). The black and magenta vertical lines indicate the look-back time of the mergers and KDC birth, respectively. The numbers indicate the stellar-mass ratios of the mergers, e.g., “13” means a merger of 1:13. |
| In the text | |
|
Fig. 12. Snapshots of the major merger and the subsequent evolution of galaxy #140593. The xy corresponds to the collision plane. Left column: surface density. Middle and right column: mean line-of-sight velocity in two different projections. The look-back time for each snapshot is indicated on the right. The size of each box is 176 × 88 kpc. |
| In the text | |
|
Fig. 13. Maps of the stellar surface brightness and the mean line-of-sight velocity for galaxy #140593 viewed along the 3D minor axis in the last snapshot, z = 0, divided into components according to their origin. The fields of view correspond to 1.5 × 1.5 rmax. |
| In the text | |
|
Fig. 14. Snapshots of the evolution of galaxy #354838, x, y, and z correspond to the major, intermediate, and minor axis of the galaxy at the end of the simulation. The look-back time for each snapshot is indicated on the right. The fields of view correspond to 1.5 × 1.0rmax. |
| In the text | |
|
Fig. 15. Examples of two Illustris KDC hosts that show two peaks in their maps of the velocity dispersion. The fields of view correspond to 6 × 6 reff. |
| In the text | |
|
Fig. 16. Examples of two Illustris galaxies with a complicated kinematic structure in the KDCs. The fields of view correspond to 1.5 × 1.5 rmax. |
| In the text | |
Current usage metrics show cumulative count of Article Views (full-text article views including HTML views, PDF and ePub downloads, according to the available data) and Abstracts Views on Vision4Press platform.
Data correspond to usage on the plateform after 2015. The current usage metrics is available 48-96 hours after online publication and is updated daily on week days.
Initial download of the metrics may take a while.