Fig. 4.
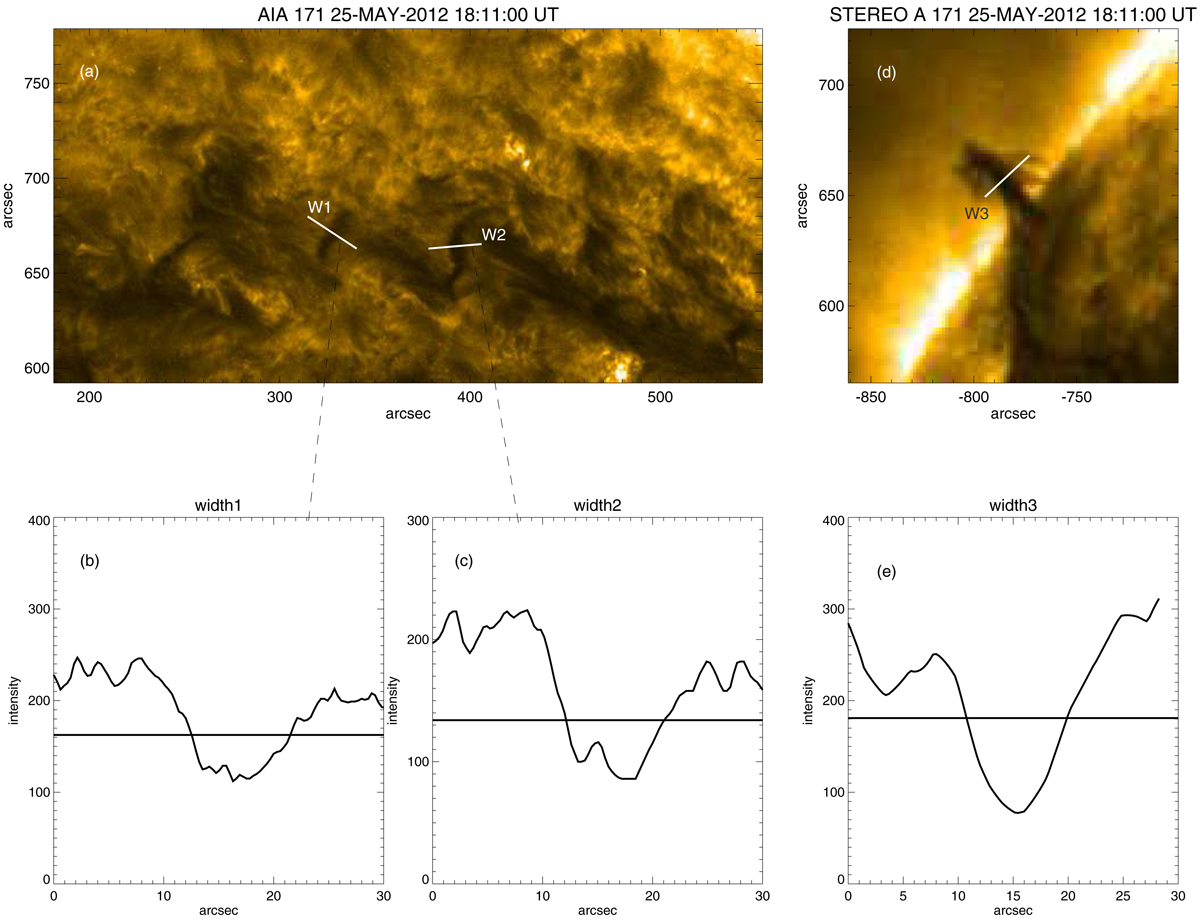
Measurement of the width of two legs of prominence PA. a: two prominence legs in the SDO/AIA 171 Å image and two cutting lines in white. b: intensity curve along the left cutting line in (a). c: intensity curve along the right cutting line in (a). d: two overlapping prominence legs in STEREO A 171 Å image with a line cut in white. e: intensity curve along the line cut in (d). The horizontal solid lines in (b), (c), and (e) show the intensity value of the leg boundaries and indicate the widths of the legs with the intersection points.
Current usage metrics show cumulative count of Article Views (full-text article views including HTML views, PDF and ePub downloads, according to the available data) and Abstracts Views on Vision4Press platform.
Data correspond to usage on the plateform after 2015. The current usage metrics is available 48-96 hours after online publication and is updated daily on week days.
Initial download of the metrics may take a while.