Fig. 8
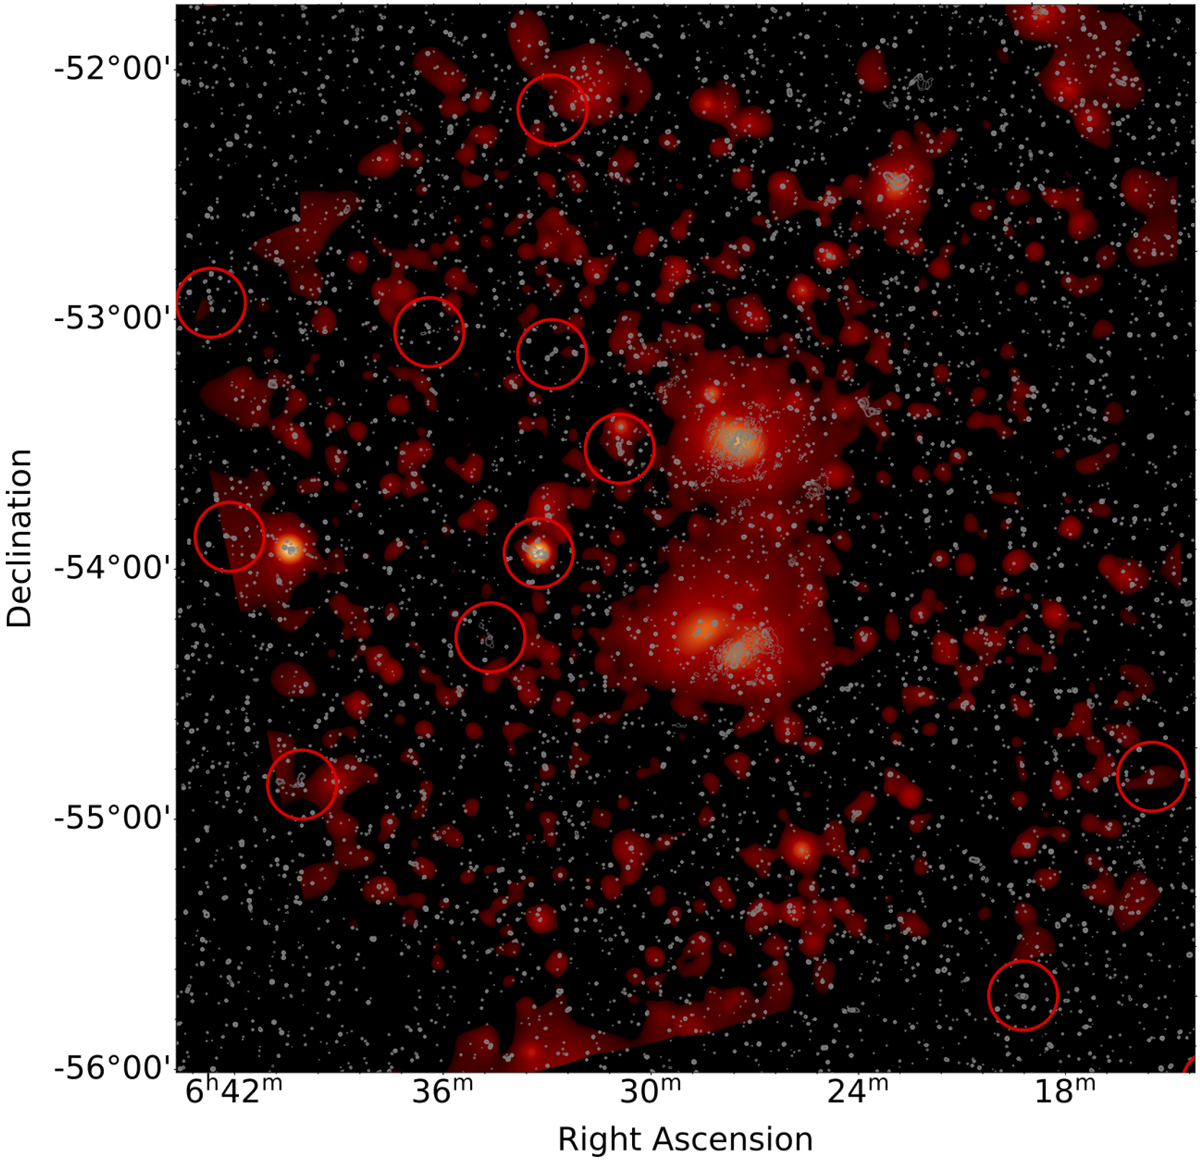
eROSITA X-ray 0.3–2.0 keV adaptively smoothed image of the A3391-A3395 field overlaid with the ASKAP/EMU radio contours (smoothed with a five-pixel Gaussian). The red circles show the locations of the GRGs within the FOV of the eROSITA observations. This is only the central half of the area of the ASKAP image, and it therefore only shows 11 of the 27 GRGs in Table 4. These GRGs in this field have higher redshifts than the A3391-A3395 cluster (see Table 4). Except for perhaps two exceptions, there is no indication that these GRGs are correlated with X-ray emission peaks. The GRG with the strongest X-ray peak is J0632–5404.
Current usage metrics show cumulative count of Article Views (full-text article views including HTML views, PDF and ePub downloads, according to the available data) and Abstracts Views on Vision4Press platform.
Data correspond to usage on the plateform after 2015. The current usage metrics is available 48-96 hours after online publication and is updated daily on week days.
Initial download of the metrics may take a while.