Fig. 7
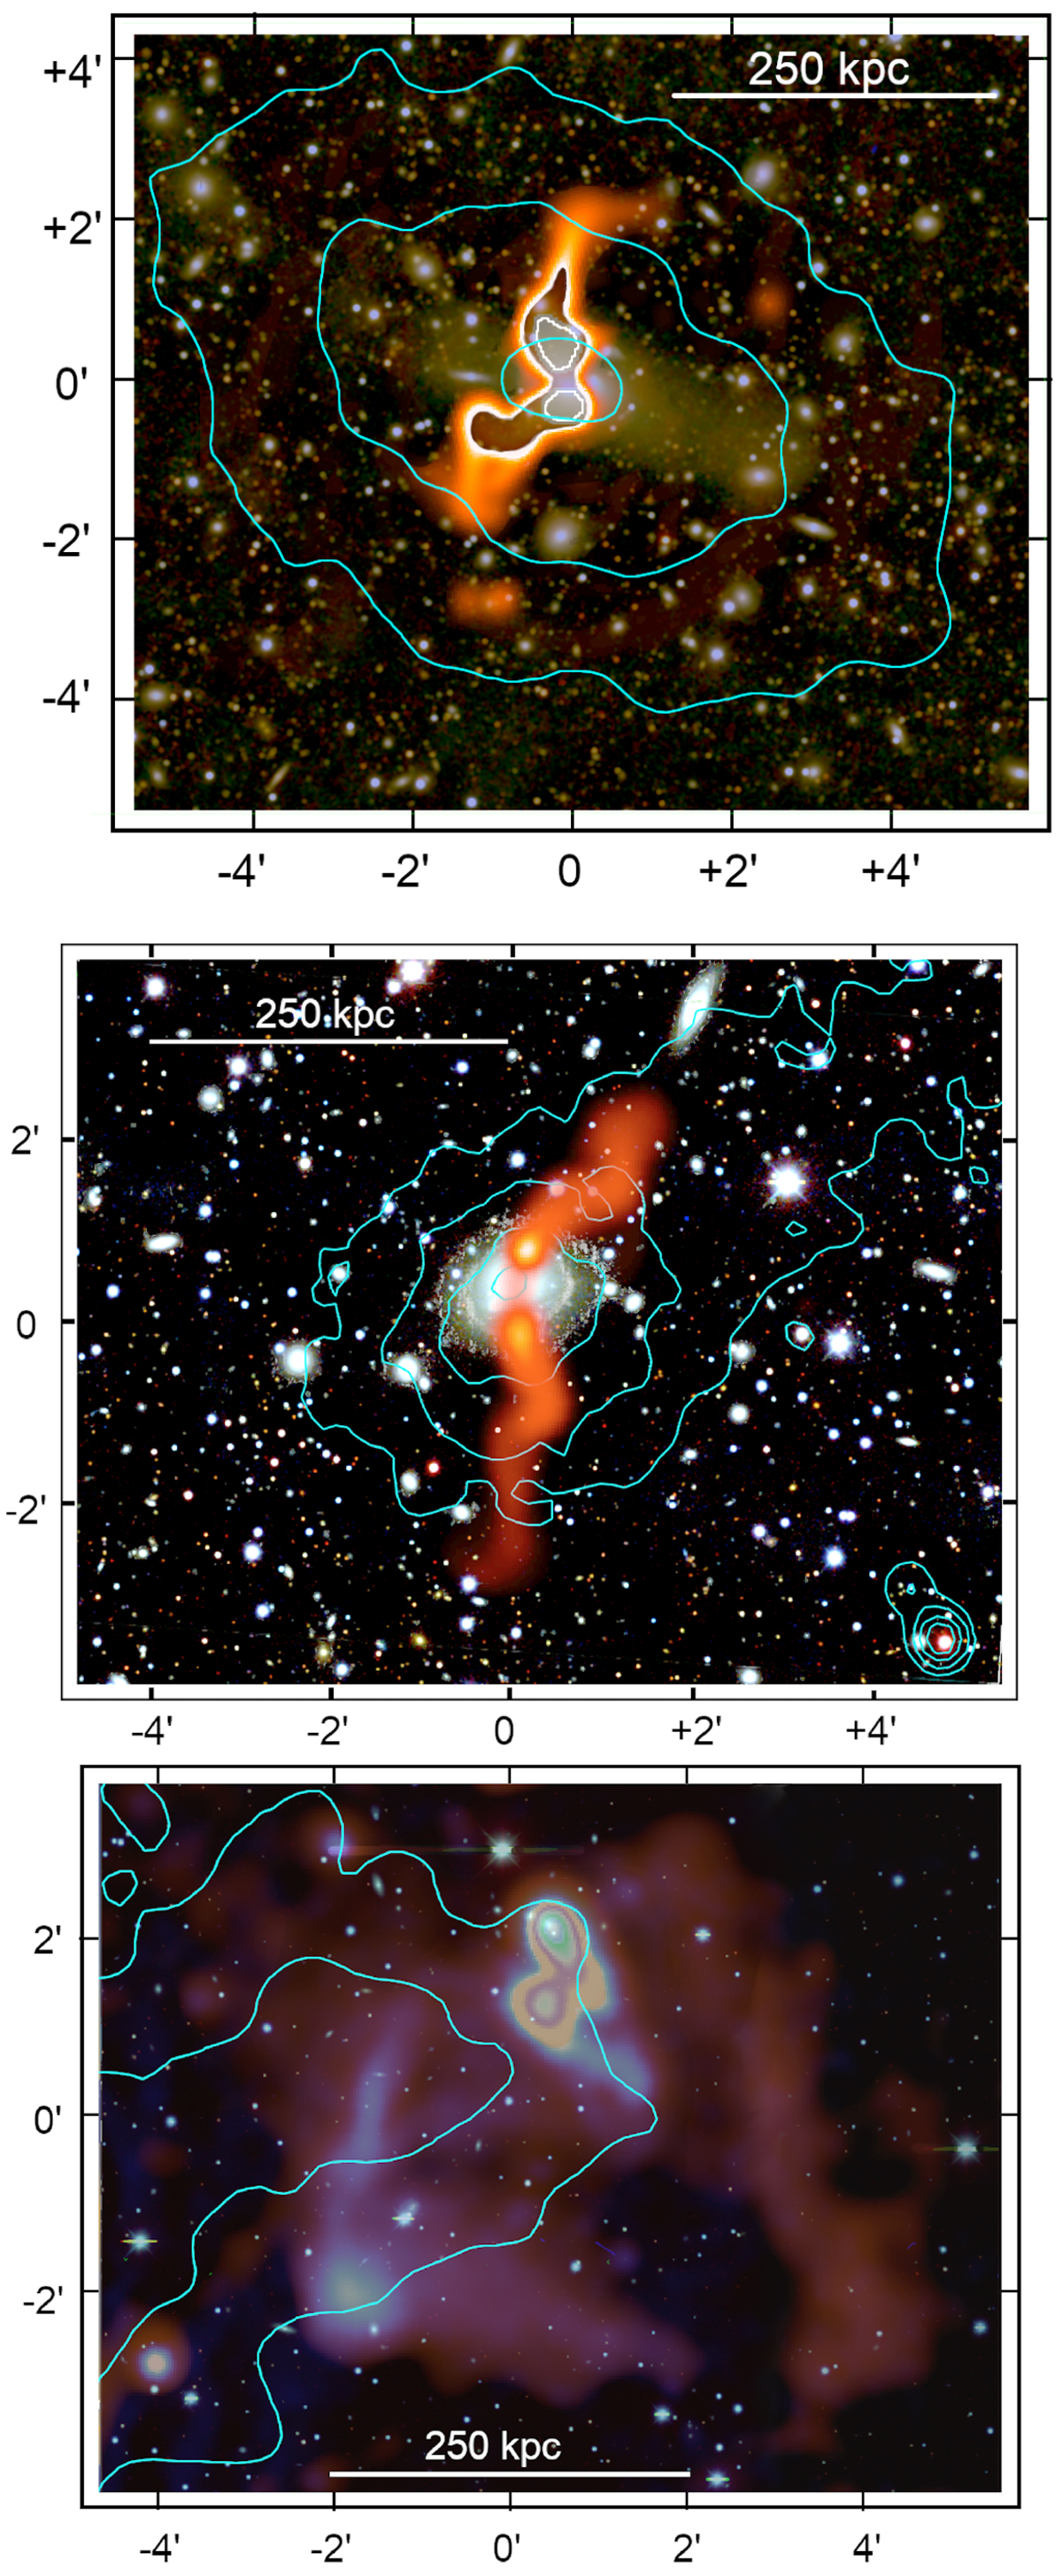
Overlays of radio images on optical images from the g, r, and z images from the DECam Legacy Survey. The turquoise contours are from eROSITA. Top: multi-wavelength close-up around radio galaxy N1. The radio image from the EMU pilot survey at a resolution of 11″ is shown in orange, with the high-brightness areas masked out and replaced with white contours. Middle: multi-wavelength close-up around the radio S2/S3 region. The radio emission from the EMU ES observation at a resolution of 11″ is shown in blue, overlaid in orange with a lower, 25″ resolution image. The high brightness areas are colour-coded separately. Bottom: multi-wavelength close-up around radio galaxy S1. The radio image from the EMU pilot survey at a resolution of 11″ is shown in orange.
Current usage metrics show cumulative count of Article Views (full-text article views including HTML views, PDF and ePub downloads, according to the available data) and Abstracts Views on Vision4Press platform.
Data correspond to usage on the plateform after 2015. The current usage metrics is available 48-96 hours after online publication and is updated daily on week days.
Initial download of the metrics may take a while.