Fig. 6
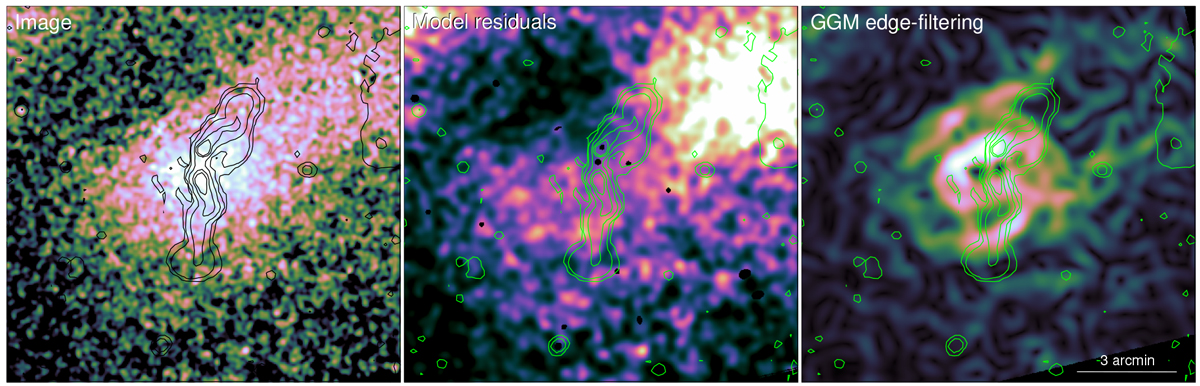
Chandra X-ray image of the S1 region and radio contours. Left: exposure-corrected Chandra image in the 0.5–5 keV band after masking point sources, smoothed by a Gaussian of σ = 3.9 arcsec. The contours show the EMU data at levels of 10−4, 10−3, 0.01, 0.05 and 0.1 Jy beam−1. Centre: fractional difference between an exposure-corrected image smoothed by a Gaussian with σ = 7.9 arcsec and a smooth model which is its average at each radius (measured from the radio nucleus). Right: edge-filtered X-ray image showing the gradient magnitude on scales of 16 arcsec, meaning that components on scales larger than 16 arcsec have been filtered out.
Current usage metrics show cumulative count of Article Views (full-text article views including HTML views, PDF and ePub downloads, according to the available data) and Abstracts Views on Vision4Press platform.
Data correspond to usage on the plateform after 2015. The current usage metrics is available 48-96 hours after online publication and is updated daily on week days.
Initial download of the metrics may take a while.