Fig. 5
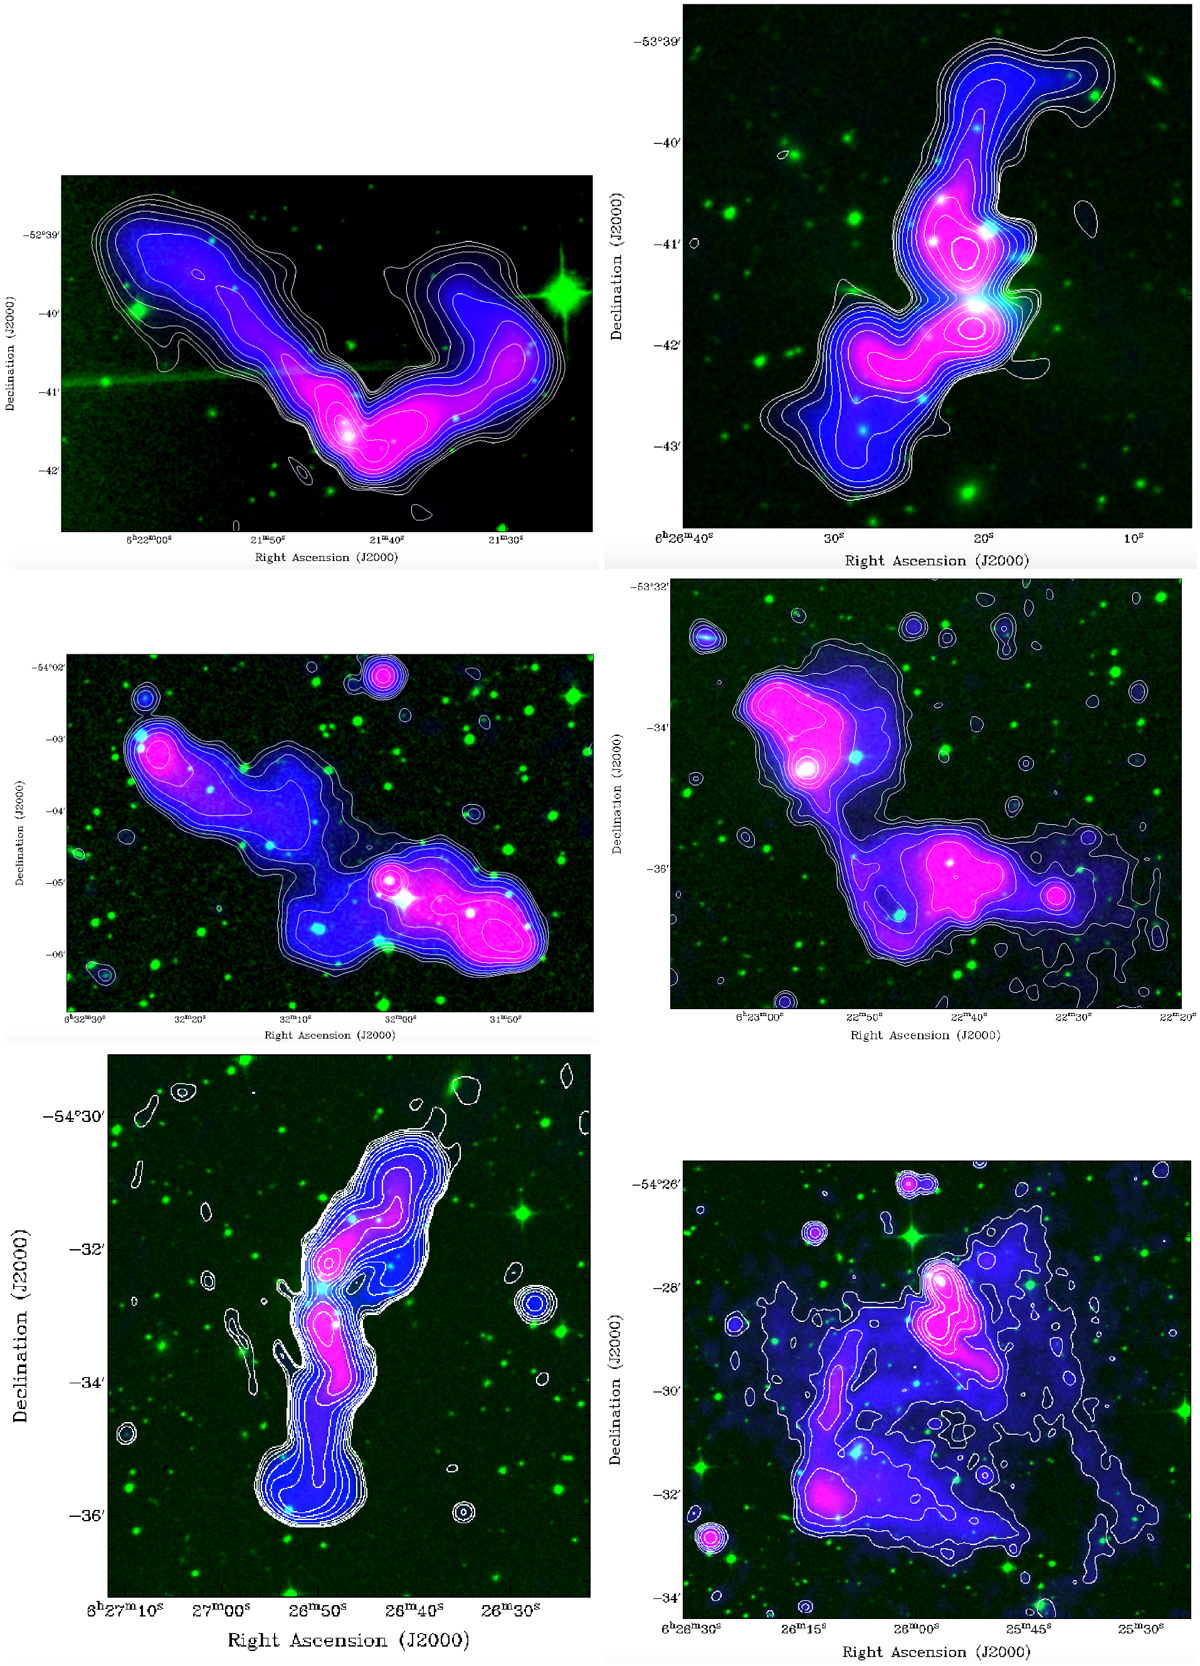
ASKAP 1 GHz radio continuum images of the radio galaxies shown in Fig. 1 overlaid on DSS2 R-band images. Top left: F2, top right: N1, middle left: F3, middle right: F1, bottom left: S1, bottom right: S2 and S3. The radio contour levels starting at 3σ are typically 0.012, 0.025, 0.05, 0.1, 0.25, 0.5, 1, 2.5, 5, 10, 25, 50, 100, 250 and 500 mJy beam−1, except for F1-F3 where a 0.006 mJy beam−1 contour is added, and N1 where the 0.012 mJy beam−1 contour is omitted.
Current usage metrics show cumulative count of Article Views (full-text article views including HTML views, PDF and ePub downloads, according to the available data) and Abstracts Views on Vision4Press platform.
Data correspond to usage on the plateform after 2015. The current usage metrics is available 48-96 hours after online publication and is updated daily on week days.
Initial download of the metrics may take a while.