Free Access
Fig. 4
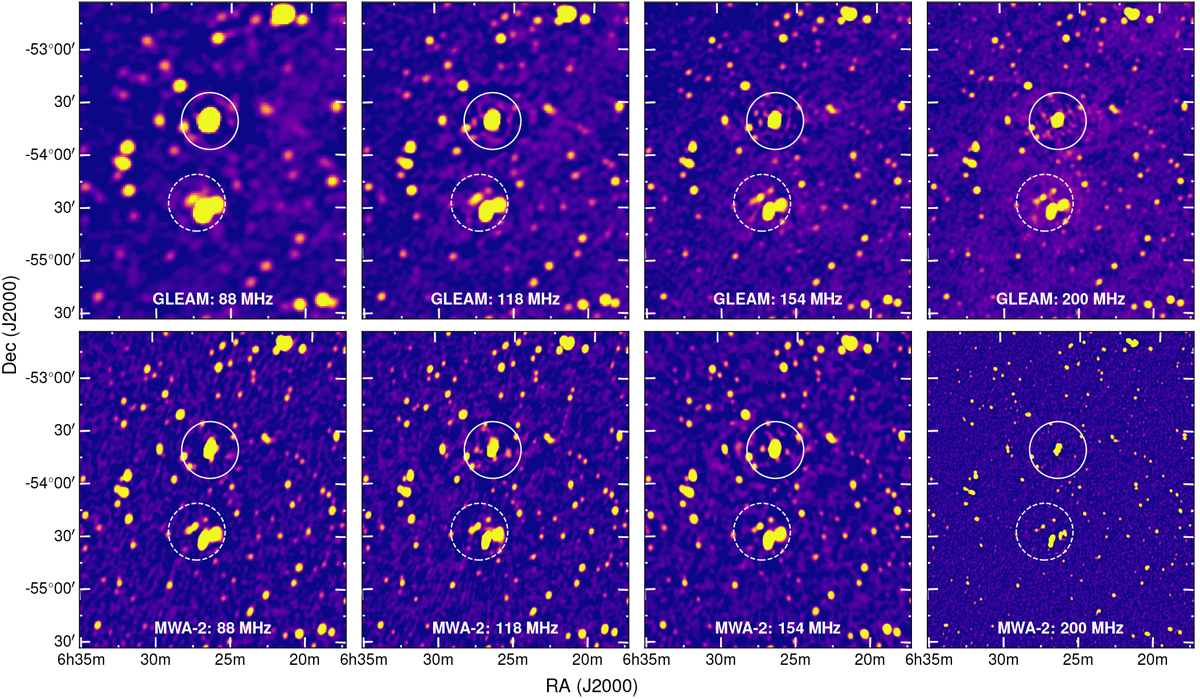
GLEAM (top row) and MWA-2 (bottom row) images of the A3391-95 system. The solid white circle indicates the location of A3391 and the dashed white circle indicates A3395. Both circles have a 1 Mpc radius at the mean cluster redshift. We note that the colour scale on each map is linear, ranging from − 1σrms to 20σrms.
Current usage metrics show cumulative count of Article Views (full-text article views including HTML views, PDF and ePub downloads, according to the available data) and Abstracts Views on Vision4Press platform.
Data correspond to usage on the plateform after 2015. The current usage metrics is available 48-96 hours after online publication and is updated daily on week days.
Initial download of the metrics may take a while.