Fig. 9
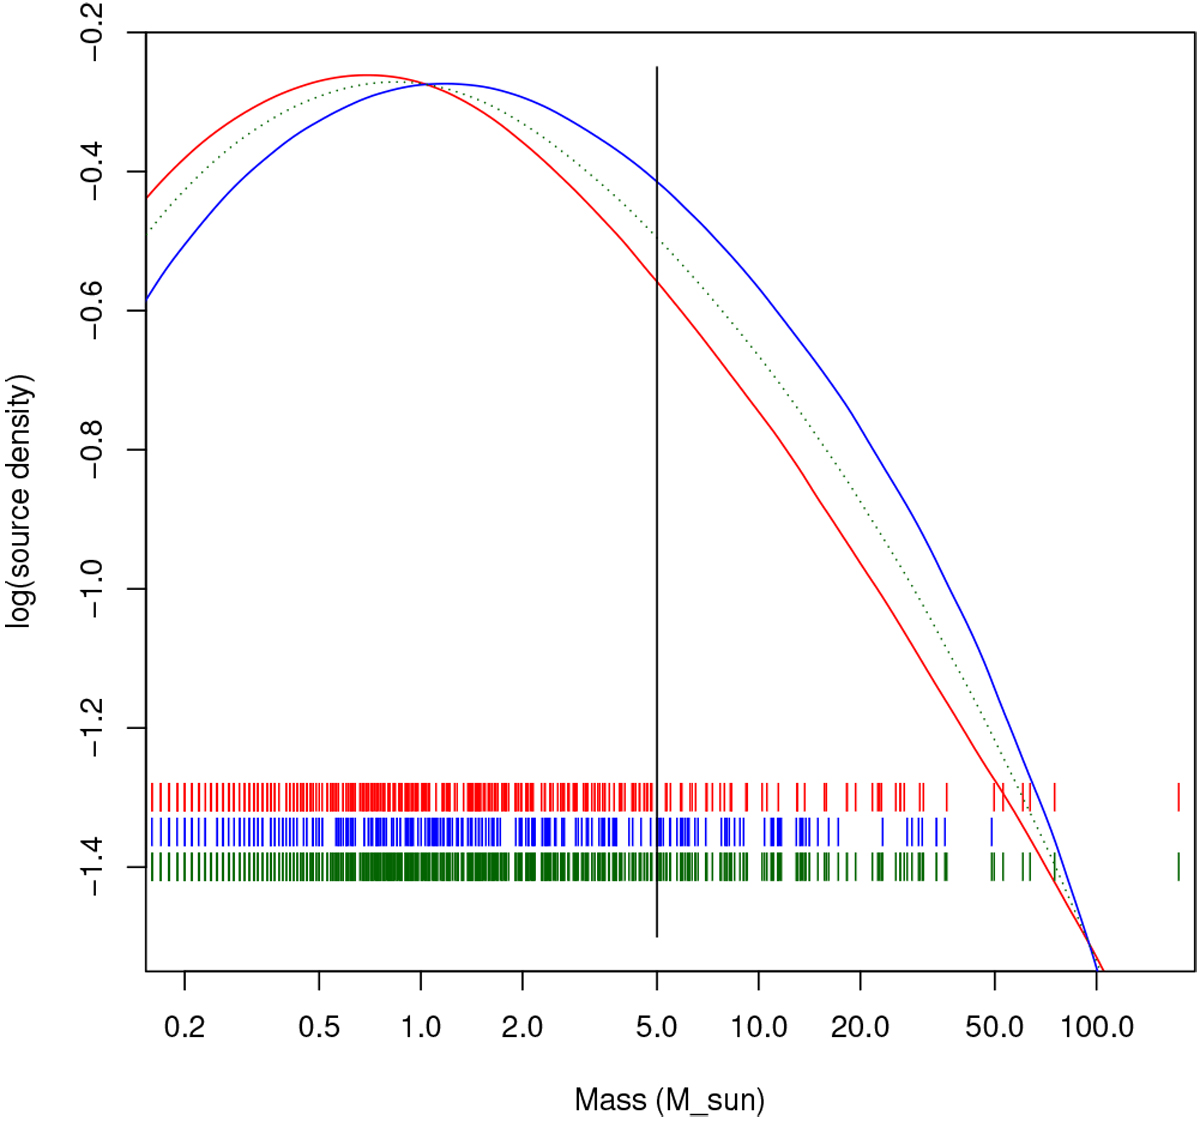
Core mass function in NGC 6357 (dashed green curve for all cores) obtained as density distribution of sources after smoothing with a Epanechnikov kernel. The red curve indicates the active region, and the blue curve indicates the more quiescent part. The vertical line marks the 5 M⊙ completeness limit (see Sect. 3.6). The small coloured bars show the masses of the single sources for each sample, following the colour coding of the distributions.
Current usage metrics show cumulative count of Article Views (full-text article views including HTML views, PDF and ePub downloads, according to the available data) and Abstracts Views on Vision4Press platform.
Data correspond to usage on the plateform after 2015. The current usage metrics is available 48-96 hours after online publication and is updated daily on week days.
Initial download of the metrics may take a while.